
Reason to trust
How Our News is Made
Strict editorial policy that focuses on accuracy, relevance, and impartiality
Ad discliamer
Morbi pretium leo et nisl aliquam mollis. Quisque arcu lorem, ultricies quis pellentesque nec, ullamcorper eu odio.
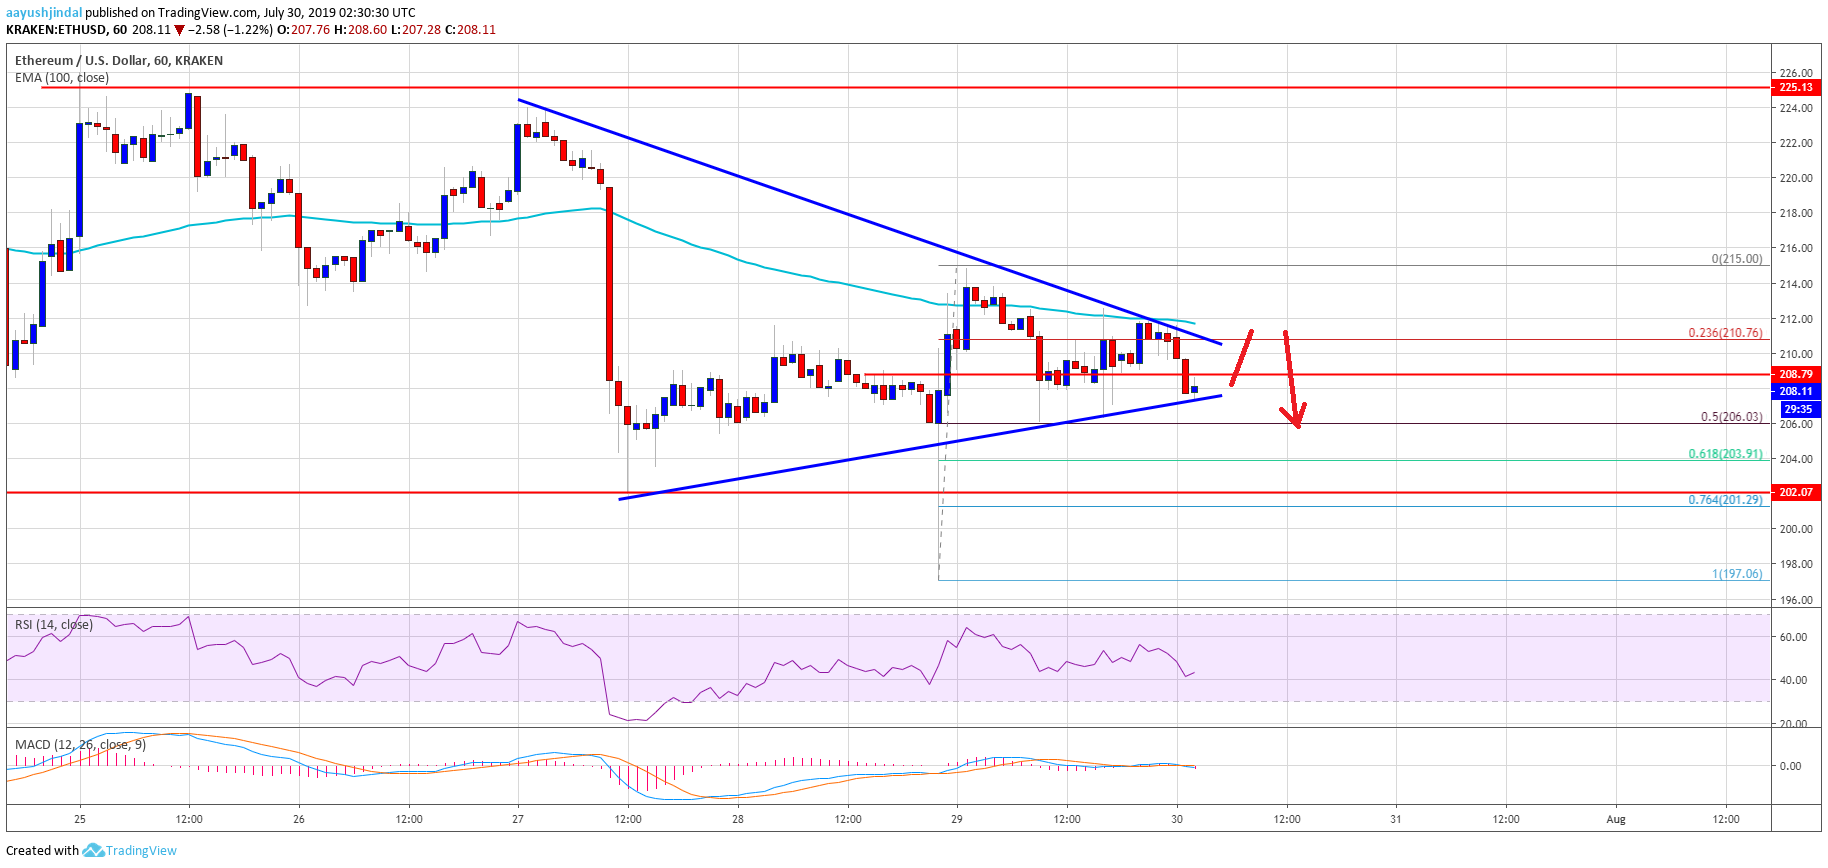
- ETH price remained supported above the $205 level, but struggled to gain traction against the US Dollar.
- The price is facing a few key resistances near the $212 and $215 levels.
- There is a contracting triangle forming with resistance near $211 on the hourly chart of ETH/USD (data feed via Kraken).
- The pair could either rally above the $215 resistance or it might soon retest the $200 support level.
Ethereum price is still facing a strong selling interest versus the US Dollar and bitcoin. ETH price needs to surpass the $215 resistance to avoid a downside break.
Ethereum Price Analysis
After a sharp dip below the $205 and $200 levels, Ethereum price started an upside correction against the US Dollar. The ETH/USD pair formed a swing low near $197 and recently recovered above the $205 and $210 levels. However, the upward move was capped by the $215 resistance level. Moreover, the 100 hourly simple moving average (currently near $212) also acted as a strong resistance.
The price topped near the $215 level and recently corrected gains. It broke the $210 level plus the 23.6% Fib retracement level of the recent recovery from the $197 low to $215 high. However, the declined was protected by the $205 support level. Moreover, the 50% Fib retracement level of the recent recovery from the $197 low to $215 high acted as a decent support zone.
At the moment, it seems like there is a contracting triangle forming with resistance near $211 on the hourly chart of ETH/USD. On the upside, there is a crucial resistance forming near $211, $212, and the 100 hourly SMA. If there is an upside break above $212, the price is likely to rally above the $215 resistance. In the mentioned case, the next possible target for the bulls could be $225.
On the other hand, if the price fails to break the $212 resistance zone, there could be a fresh bearish wave. An initial support is near the $205 level, below which the price could test the main $200 support level. Any further gains will most likely open the doors for more losses towards the $185 support level.
Looking at the chart, Ethereum price is showing a few negative signs below the $211-212 resistance area. The bulls need to soon gain pace above $212 to start a decent upward move. If not, the price is likely to react to the downside towards or below $200 in the near term.
ETH Technical Indicators
Hourly MACD – The MACD for ETH/USD is slowly moving into the bearish zone.
Hourly RSI – The RSI for ETH/USD is currently below the 50 level and holding the 40 level.
Major Support Level – $205
Major Resistance Level – $212


