Key Highlights
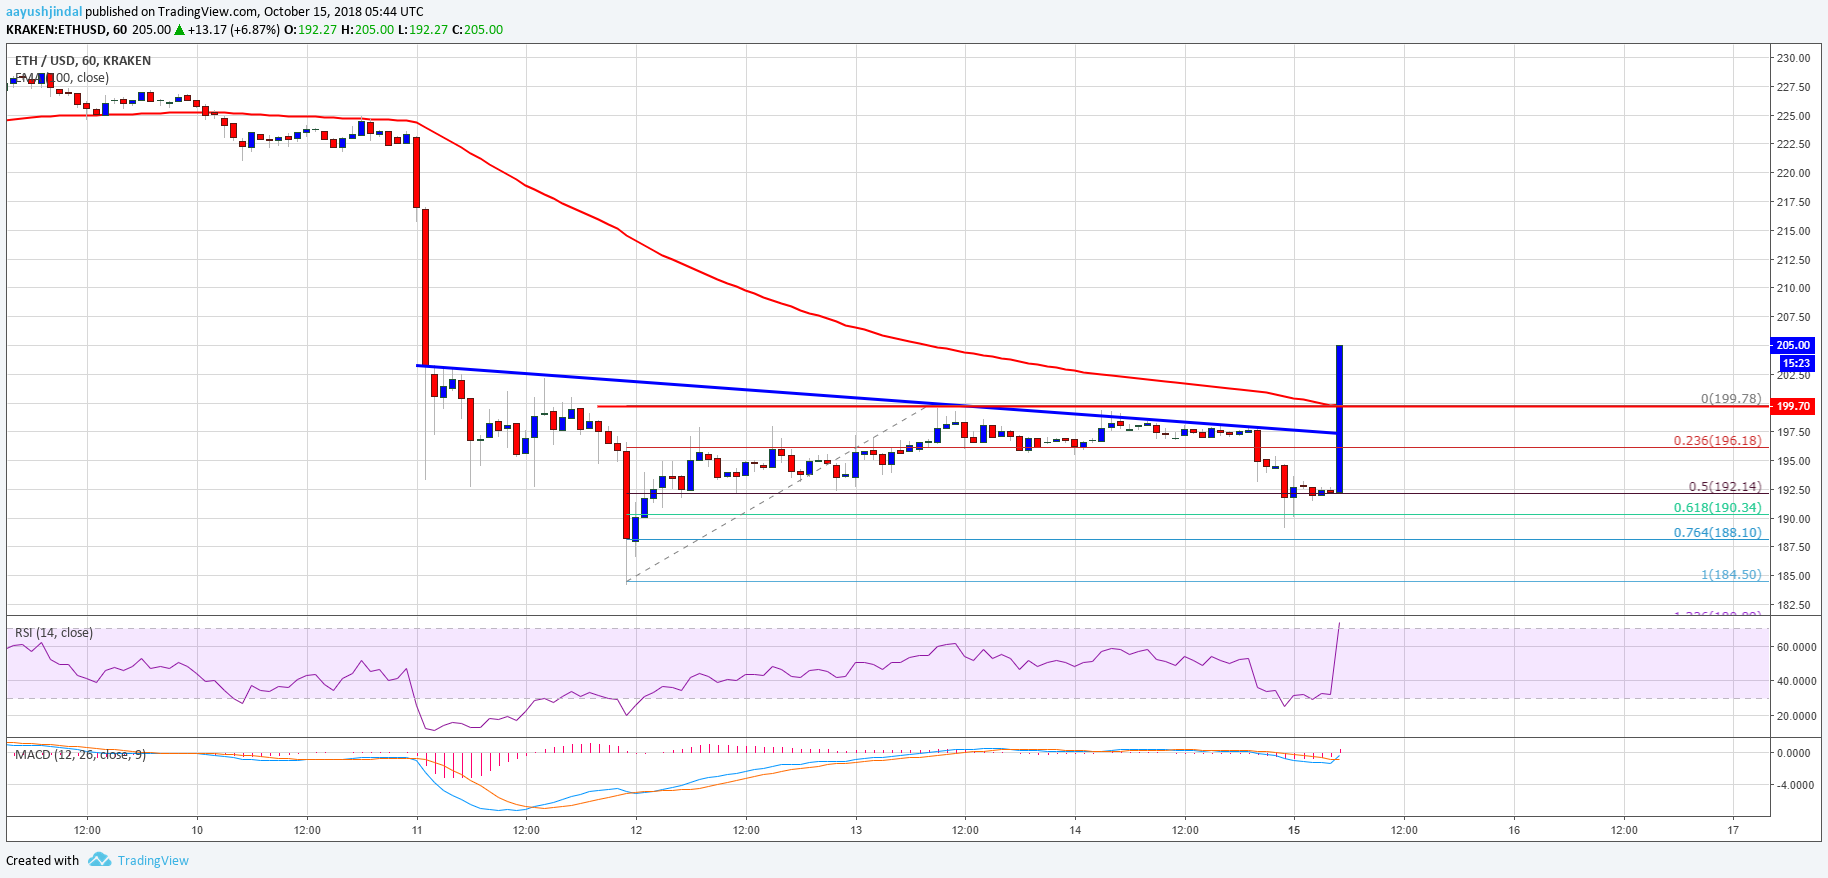
- ETH price finally gained momentum and broke the $197 resistance against the US Dollar.
- There was a break above a key bearish trend line with resistance at $197 on the hourly chart of ETH/USD (data feed via Kraken).
- The pair is now placed nicely above the $197 and $200 resistance levels.
Ethereum price gained momentum recently against the US Dollar and bitcoin. ETH/USD is now placed for more gains above the $197, $198 and $200 resistance levels.
Ethereum Price Analysis
Recently, there was a minor upside move from the $184 swing low in ETH price against the US Dollar. The ETH/USD pair traded above the $190 and $192 resistance levels. However, the upside move was capped by the $199-200 area. The price failed to break the $200 zone and slowly turned south. It declined below the 50% Fib retracement level of the recent wave from the $184 low to $199 high.
However, buyers appeared near the $188-190 area. Moreover, the 61.8% Fib retracement level of the recent wave from the $184 low to $199 high also acted as a support. Later, the price jumped higher and moved above the $190 and $197 resistance levels with a positive angle. More importantly, the price surpassed a strong resistance near the $200 level. There was also a break above a key bearish trend line with resistance at $197 on the hourly chart of ETH/USD. Above the trend line, the 100 hourly simple moving average was beached near the $199 level. Therefore, a break and close above the $199-200 zone is a positive zone.

Looking at the chart, ETH price seems to be gaining pace above $197. As long as there is no false break above the $200 handle and the 100 hourly SMA, there are chances of more upsides. On the upsides, the next resistances are at $207 and $210.
Hourly MACD – The MACD is moving in the bullish zone.
Hourly RSI – The RSI currently near the 60 level with a bearish angle.
Major Support Level – $197
Major Resistance Level – $210


