Key Highlights
- ETH price failed to recover above the $90 resistance and declined recently against the US Dollar.
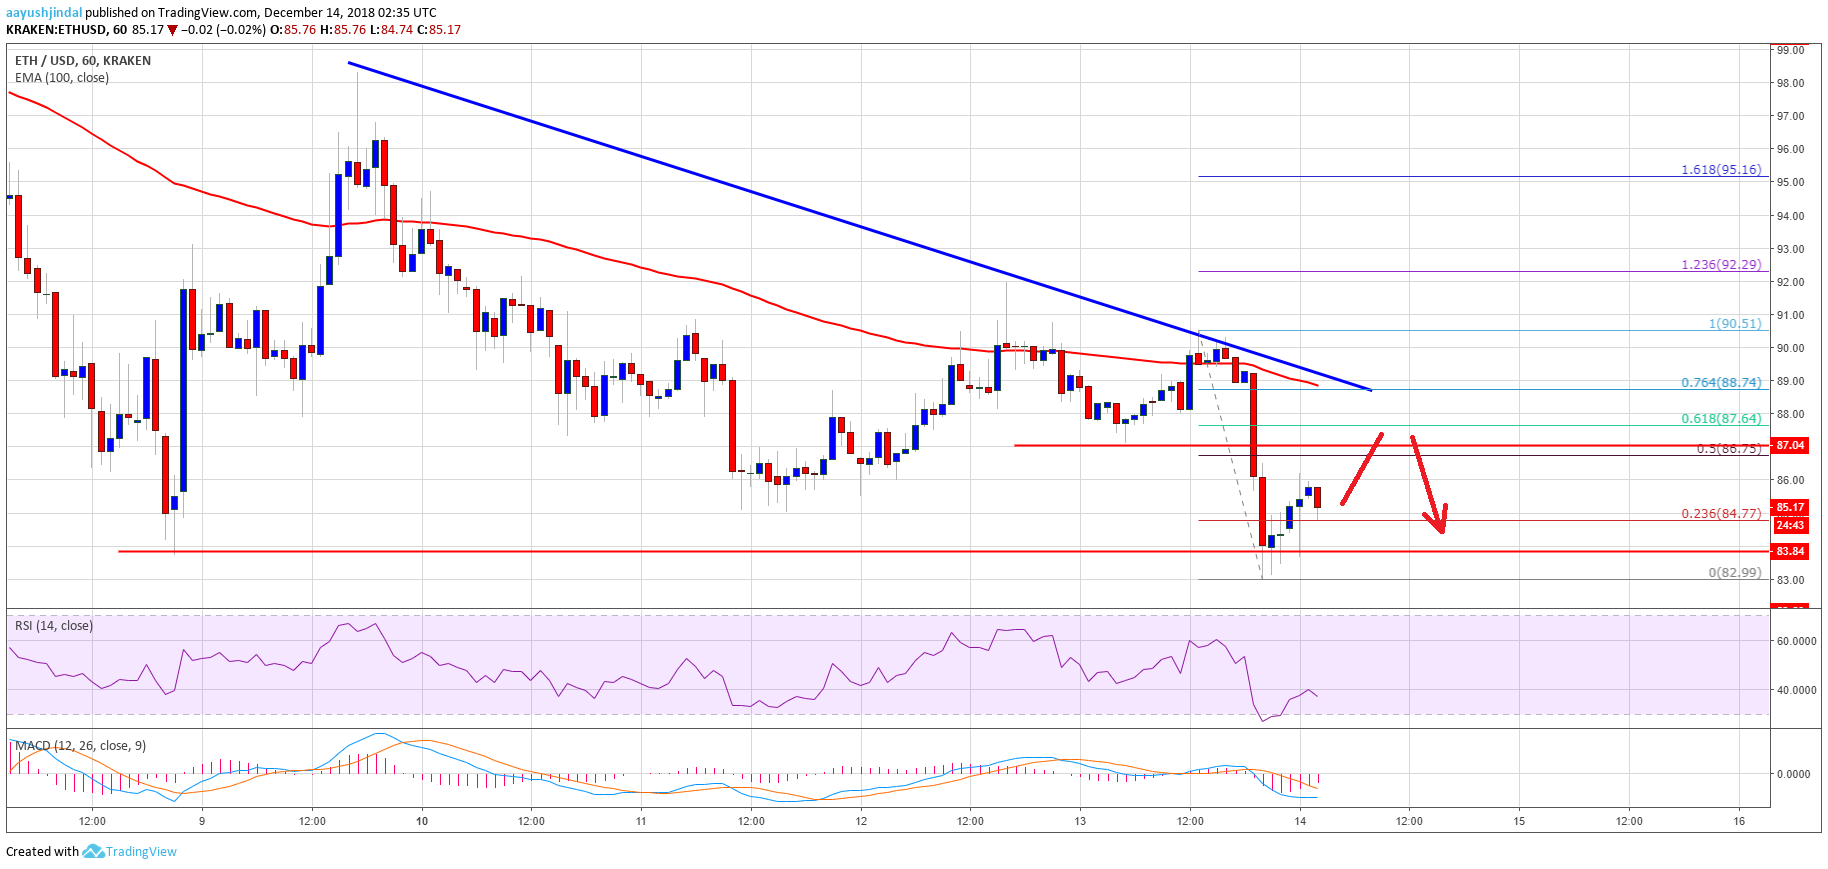
- There is a new connecting bearish trend line formed with resistance at $89 on the hourly chart of ETH/USD (data feed via Kraken).
- The pair is likely to decline further below the $83 and $80 support levels in the near term.
Ethereum price declined further below key supports against the US Dollar and bitcoin. ETH/USD could accelerate losses if there is a break below $80.
Ethereum Price Analysis
Recently, there was a minor upside move above $88 and $90 in ETH price against the US Dollar. The ETH/USD pair tested the $90 resistance area and faced a solid selling interest. As a result, there was a bearish reaction and the price declined below the $87 and $85 support levels. There was also a close below the $87 level and the 100 hourly simple moving average.
A new intraday low was formed at $82.99 and it seems like the price may decline further. It is currently correcting higher above $85. An initial resistance is the 50% Fib retracement level of the recent decline from the $90 high to $83 low. Moreover, there is a new connecting bearish trend line formed with resistance at $89 on the hourly chart of ETH/USD. An intermediate resistance is the 61.8% Fib retracement level of the recent decline from the $90 high to $83 low. It seems like there is a cluster of resistances formed between $88 and $90. Therefore, as long as the price is below $90, it may continue to decline.

Looking at the chart, ETH price could even break the $83 support level. The next key support is at $80, below which the price will most likely accelerate towards the $75 level.
Hourly MACD – The MACD is now back in the bearish zone.
Hourly RSI – The RSI is currently well below the 50 level and heading towards 30.
Major Support Level – $80
Major Resistance Level – $90


