
Reason to trust
How Our News is Made
Strict editorial policy that focuses on accuracy, relevance, and impartiality
Ad discliamer
Morbi pretium leo et nisl aliquam mollis. Quisque arcu lorem, ultricies quis pellentesque nec, ullamcorper eu odio.
- Ethereum is showing positive signs above the $150 and $152 resistance levels against the US Dollar.
- The price is currently trading near the $155 resistance and it could rise further.
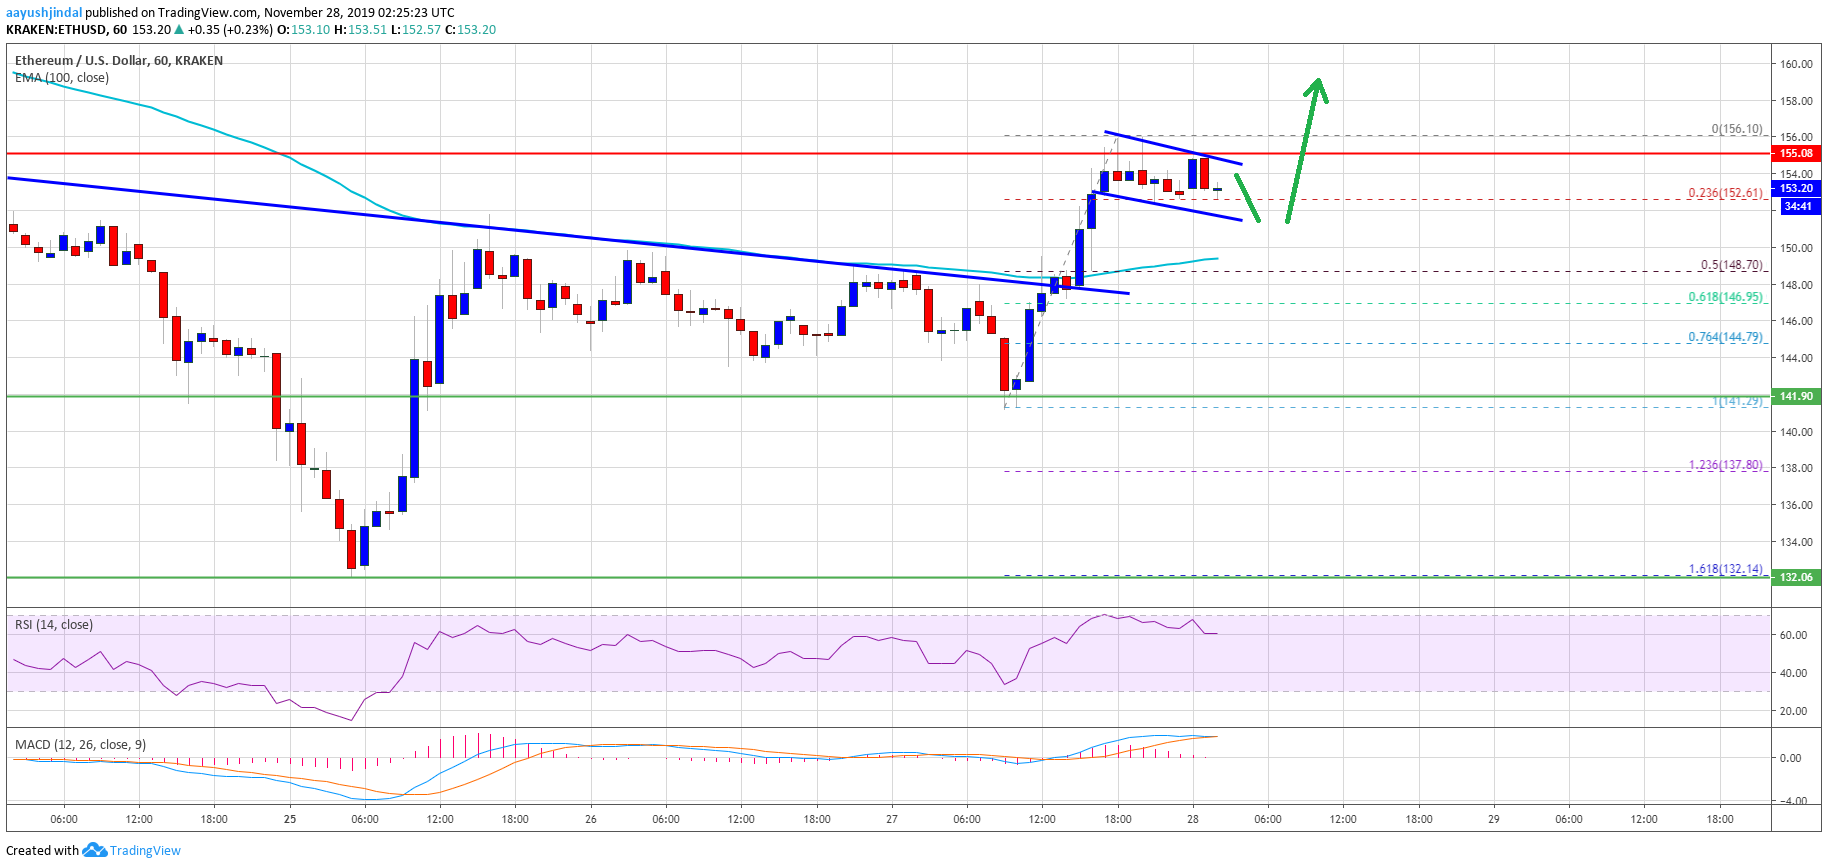
- There is a short term bullish flag forming with resistance near $155 on the hourly chart of ETH/USD (data feed via Kraken).
- The price could rise nicely above the $155 and $160 resistance levels in the near term.
Ethereum price is gaining bullish momentum above $150 versus the US Dollar, while bitcoin rallied above $7,500. ETH price is likely to aim $165 if it settles above $155.
Ethereum Price Analysis
Recently, there was a nice recovery in Ethereum above the $140 and $142 resistance levels against the US Dollar. Later, ETH price consolidated above the $142 support area and below the 100 hourly simple moving average.
Finally, the bulls gained strength and were able to push the price above the $150 resistance area and the 100 hourly simple moving average. Besides, yesterday’s key bearish trend line with resistance near $150 was breached on the hourly chart of ETH/USD.
It opened the doors for more gains above the $152 resistance. Ethereum tested the $155-$156 resistance area and it is currently consolidating gains. An initial support is near the $152 level.
Furthermore, the 23.6% Fib retracement level of the recent rise from the $142 swing low to $156 high is also near the $152 level. More importantly, there is a short term bullish flag forming with resistance near $155 on the same chart.
If there is an upside break above $155 and the price climbs above the $156 high, there could be more gains. In the mentioned case, the price may perhaps surpass the $160 resistance and continue higher.
The next key resistance of the target for the current recovery could be $165. Conversely, the price might fail to continue above the $155 and $156 resistance levels.
On the downside, the price may revisit the $148 zone if it breaks the $152 support. The 50% Fib retracement level of the recent rise from the $142 swing low to $156 high is also near the $148 level. If there are more downsides below $148 and the 100 hourly SMA, the price will most likely retest the $142 support.
Looking at the chart, Ethereum price is showing positive signs above the $152 and $148 support levels. The current price action suggests high chances of more gains above $155 and $158.
ETH Technical Indicators
Hourly MACD – The MACD for ETH/USD is slowly losing pace in the bullish zone.
Hourly RSI – The RSI for ETH/USD is currently correcting lower from 65 and it could test the 50 level.
Major Support Level – $148
Major Resistance Level – $155


