
Reason to trust
How Our News is Made
Strict editorial policy that focuses on accuracy, relevance, and impartiality
Ad discliamer
Morbi pretium leo et nisl aliquam mollis. Quisque arcu lorem, ultricies quis pellentesque nec, ullamcorper eu odio.
- ETH price started a strong upward move and broke the key $300 barrier against the US Dollar.
- Bitcoin price gained momentum above $10,000 and $11,000 levels and is currently consolidating.
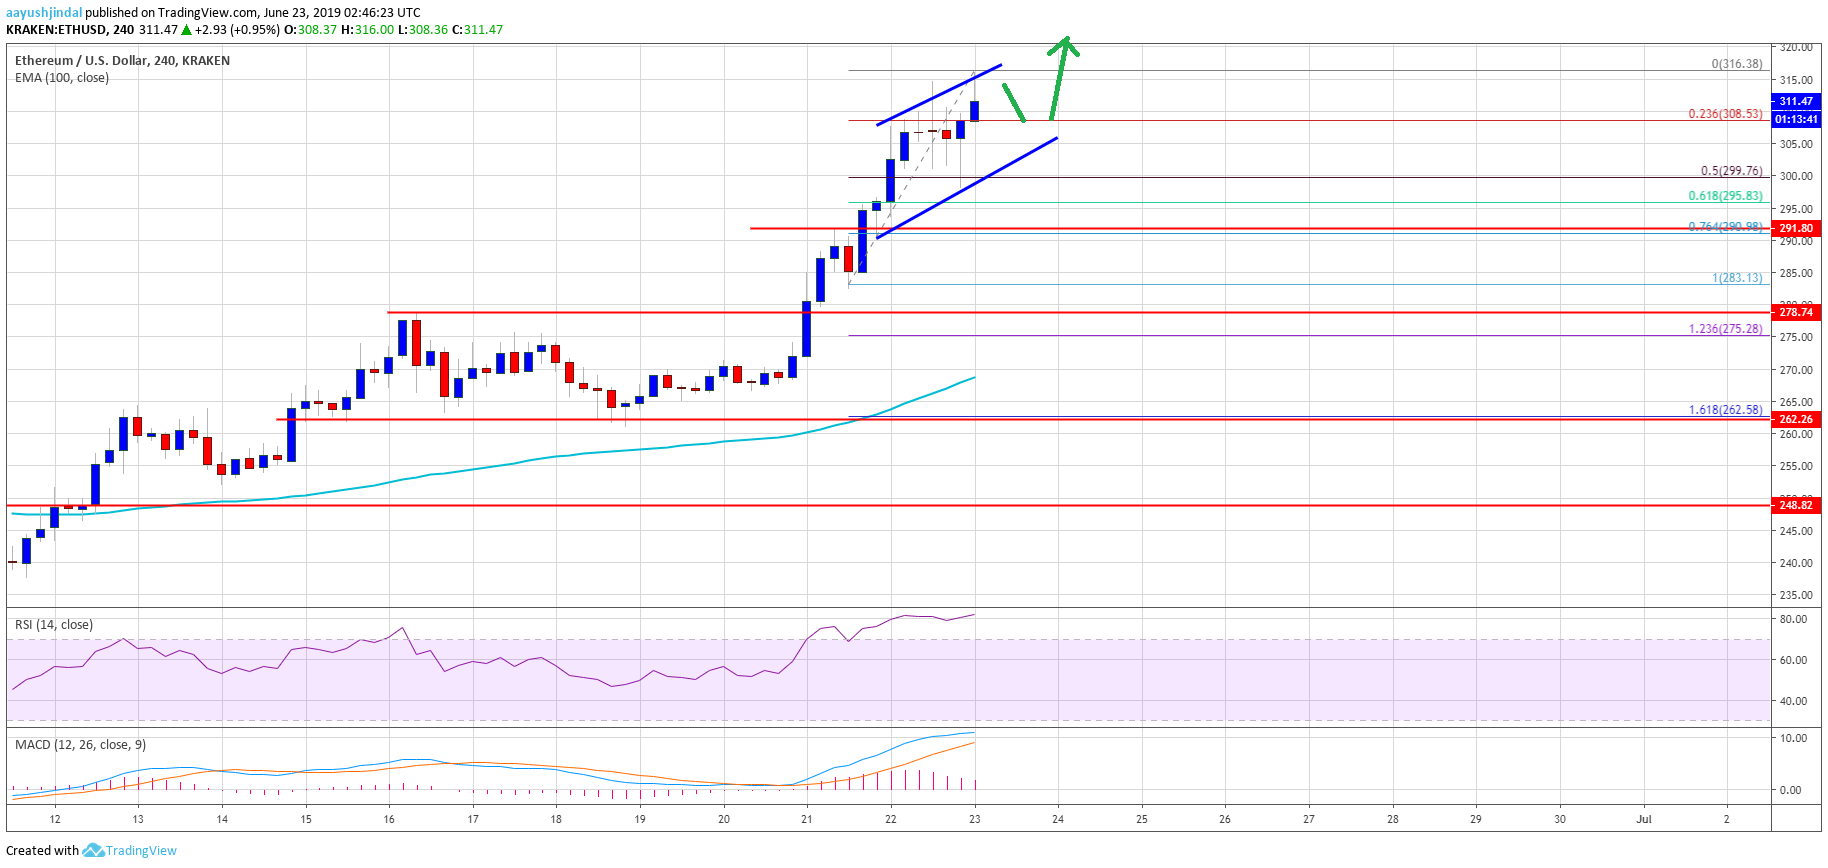
- There is a major ascending channel in place with support near $305 on the 4-hours chart of ETH/USD (data feed via Kraken).
- The pair is likely to break the $320 resistance and it could even test the $340 resistance area.
Ethereum price is rallying above key resistances such as $300 against the US Dollar, similar to bitcoin. ETH could continue to move higher towards the next key hurdles near $340 and $350.
Ethereum Price Weekly Analysis
This past week, Ethereum price started a major upward move above the $280 resistance against the US Dollar. The ETH/USD pair broke the main $288 and $290 resistance levels to follow bitcoin’s super rise. It even broke the $300 barrier and settled well above the 100 simple moving average (4-hours). The bulls are currently in action and the price traded to a new 2019 high at $316.
It is currently showing a lot of positive signs above $305 and $300. An initial support is near the 23.6% Fib retracement level of the recent rally from the $283 low to $316 swing high. Moreover, there is a major ascending channel in place with support near $305 on the 4-hours chart of ETH/USD. Below the channel support, the next important support is near the $300 level.
The 50% Fib retracement level of the recent rally from the $283 low to $316 swing high is also near the $300 support. Therefore, if the price corrects lower, it is likely to find a strong support near $305 and $300. The main pivot level is near the $290 level. It coincides with the 76.4% Fib retracement level of the recent rally from the $283 low to $316 swing high.
On the upside, an initial resistance is near the $318 and $320 levels. If there is an upside break above the $325 level, the price will most likely surge towards the $340 and $350 levels.
The above chart indicates that Ethereum price started a major uptrend above $300. An upside break above the recent high will most likely set the pace for more gains towards $325 and $340. On the downside, the main supports are near $305 and $300. Besides, as long as the price s above $290, it remains in an uptrend.
Technical Indicators
4 hours MACD – The MACD for ETH/USD is slowly reducing its bullish slope.
4 hours RSI – The RSI for ETH/USD is currently well above the 70 level, with no sign of a downside correction.
Major Support Level – $300
Major Resistance Level – $325


