Reason to trust
How Our News is Made
Strict editorial policy that focuses on accuracy, relevance, and impartiality
Ad discliamer
Morbi pretium leo et nisl aliquam mollis. Quisque arcu lorem, ultricies quis pellentesque nec, ullamcorper eu odio.
- ETH price recovered recently, but it struggled to clear the $275 resistance against the US Dollar.
- The price is currently under pressure and it could decline below the $260 support area.
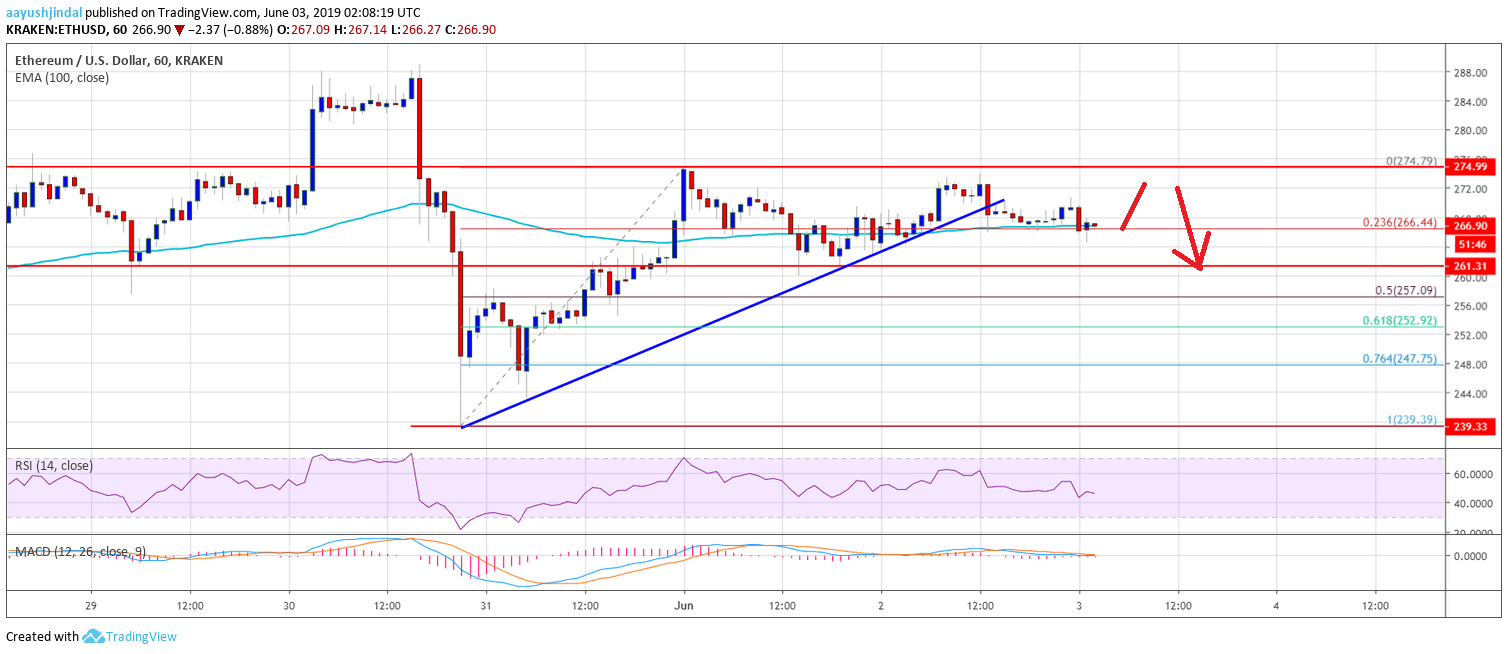
- There was a break below a major bullish trend line with support at $270 on the hourly chart of ETH/USD (data feed via Kraken).
- The pair is currently showing bearish signs and it could decline towards the $250 support area.
Ethereum price is slowly moving lower versus the US Dollar and bitcoin. ETH price could decline towards the $250 support level before it might climb back above $275.
Ethereum Price Analysis
After a strong recovery, Ethereum price struggled to clear the $274 and $275 resistances against the US Dollar. The ETH/USD pair formed a swing high near $275 and recently started trading in a range. It declined below the $272 and $270 support levels. Later, there was another attempt to clear the $274 level, but the bulls struggled to gain momentum. As a result, there was another decline and the price is now trading below the $270 level.
There was a break below a major bullish trend line with support at $270 on the hourly chart of ETH/USD. The pair is currently trading near the $266 level and the 100 hourly simple moving average. Besides, it is testing the 23.6% Fib retracement level of the recent wave from the $239 swing low to $274 high. On the downside, an immediate support is near the $260 level, below which there is a risk of more losses below the $255 level. An intermediate support is near $257 and the 50% Fib retracement level of the recent wave from the $239 swing low to $274 high.
The main support is near the $250 level. If the price fails to stay above the $250 support area, there is a risk of a strong decline. The next stop for sellers could be near $242 and $240. On the upside, the key hurdle for the bulls is near the $274 and $275 levels. If there is an upside break above the $275 level, the price could continue above $280.
Looking at the chart, Ethereum price is showing a few negative signs below the $274 level. Therefore, there is a risk of a short term decline below $260 before the price could start a decent upward move. A proper close above $275 might kick start a move towards the $280 level.
ETH Technical Indicators
Hourly MACD – The MACD for ETH/USD is slowly moving in the bearish zone, with a few negative signs.
Hourly RSI – The RSI for ETH/USD is currently well below the 50 level and it might decline to 40.
Major Support Level – $260
Major Resistance Level – $275