
Reason to trust
How Our News is Made
Strict editorial policy that focuses on accuracy, relevance, and impartiality
Ad discliamer
Morbi pretium leo et nisl aliquam mollis. Quisque arcu lorem, ultricies quis pellentesque nec, ullamcorper eu odio.
- ETH price decline recently and retested the key $231 support area declined against the US Dollar.
- The price started a decent rebound and recovered above the $240 and $242 levels.
- There is a major bearish trend line forming with resistance near $248 on the hourly chart of ETH/USD (data feed via Kraken).
- The pair must clear the $248 and $250 resistances to continue higher in the coming sessions.
Ethereum price is currently recovering versus the US Dollar, but consolidating vs bitcoin. ETH must settle above the $250 barrier to continue higher towards $265 in the near term.
Ethereum Price Analysis
After a long struggle near the $265 level, Ethereum price started a downside correction against the US Dollar. The ETH/USD pair traded below the key $250 and $245 support levels. There was even a close below the $250 level and the 100 hourly simple moving average. The decline was such that the price tested the key $231 support area. A swing low was formed near $231.39 and the price recently started an upward move. It traded above the $240 level and the 23.6% Fib retracement level of the recent drop from the $257 high to $231 low.
The price is currently trading above $245, and the 50% Fib retracement level of the recent drop from the $257 high to $231 low. However, there is a strong resistance forming near $248 and $250. There is also a major bearish trend line forming with resistance near $248 on the hourly chart of ETH/USD. Moreover, the 100 hourly simple moving average is also acting as a hurdle along with the 61.8% Fib retracement level of the recent drop from the $257 high to $231 low.
Therefore, a close above the $248 and $250 resistance levels is must for a strong upward move. The next key resistance are near $255 and $265. Conversely, if the price fails to move above $250, it could retreat and decline back below $244. Besides, an immediate support below $244 is at $240. If there are more losses, the price may revisit the key $231 support area.
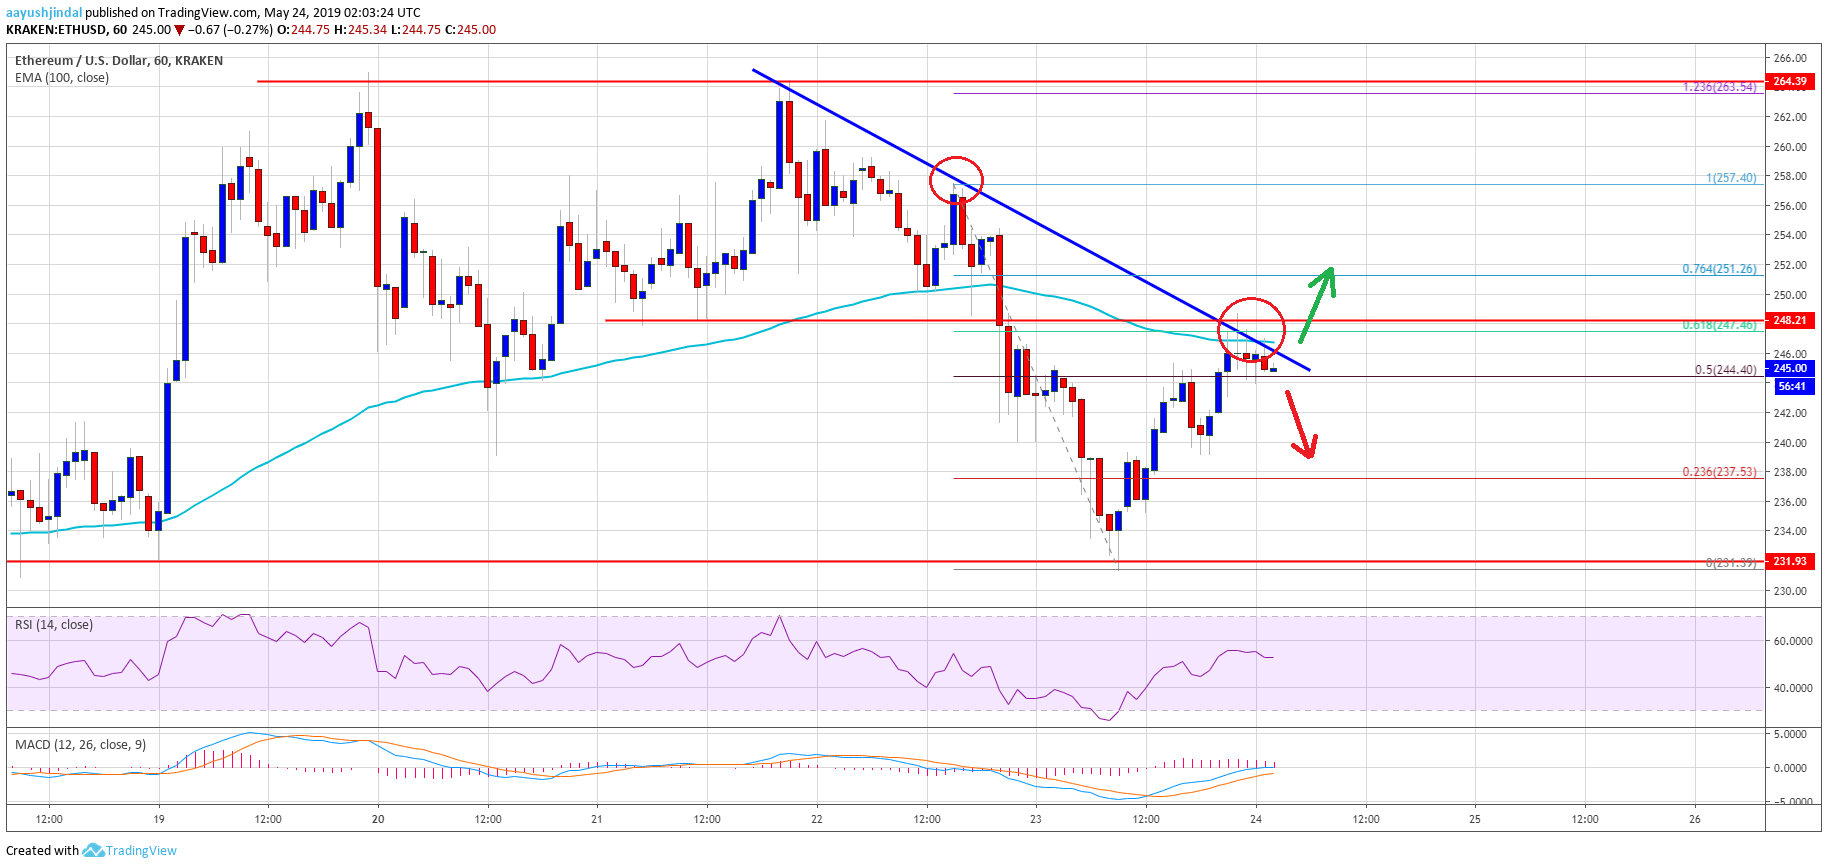
Looking at the chart, Ethereum price is clearly trading near a crucial juncture at $248-250. If it surpasses the $250 barrier, there could be more gains towards the $265 resistance level. Above $265, the next major hurdle for the bulls is near $280. On the downside, the main supports are near $240, $234 and $231.
ETH Technical Indicators
Hourly MACD – The MACD for ETH/USD is slowly losing momentum in the bullish zone.
Hourly RSI – The RSI for ETH/USD is currently just above the 50 level, with a minor bearish angle.
Major Support Level – $231
Major Resistance Level – $250