Reason to trust
How Our News is Made
Strict editorial policy that focuses on accuracy, relevance, and impartiality
Ad discliamer
Morbi pretium leo et nisl aliquam mollis. Quisque arcu lorem, ultricies quis pellentesque nec, ullamcorper eu odio.
- ETH price corrected higher recently but failed to break the $160 resistance against the US Dollar.
- The price is currently moving lower and it might revisit the $150 or even $146 support level.
- There is a key connecting bearish trend line formed with resistance at $155 on the hourly chart of ETH/USD (data feed via Kraken).
- The pair could recover if it surpasses the $156 resistance and the 100 hourly simple moving average.
Ethereum price is facing an increase in selling pressure versus the US Dollar and bitcoin. ETH remained capped below $160 and it is now declining towards the $150 support.
Ethereum Price Analysis
After a strong decline below $150, Ethereum price started a short term upside correction against the US Dollar. The ETH/USD pair gained traction above the $154 and $155 resistance levels. The pair climbed towards the $160 level, but it struggled a lot near the $158 level and the 100 hourly simple moving average. The price topped below the $159 level and recently started a fresh decline. It broke the $155 and $154 support levels.
There was a break below the 23.6% Fib retracement level of the recent wave from the $146 swing low to $149 swing high. Moreover, there was a break below an ascending channel with support at $155 on the hourly chart of ETH/USD. The pair tested the 50% Fib retracement level of the recent wave from the $146 swing low to $149 swing high. On the downside, a break below the $152 level may open the doors for more losses below the $150 support level. The next key support is at $146, below which the price may test $142.
On the upside, there is a key connecting bearish trend line formed with resistance at $155 on the same chart. Above the trend line, the main resistance is near $156 and the 100 hourly SMA. A convincing break above the $156 resistance may push the price towards the $160 resistance level. If buyers gain control above $160, the price could stage a decent comeback above the $166 level.
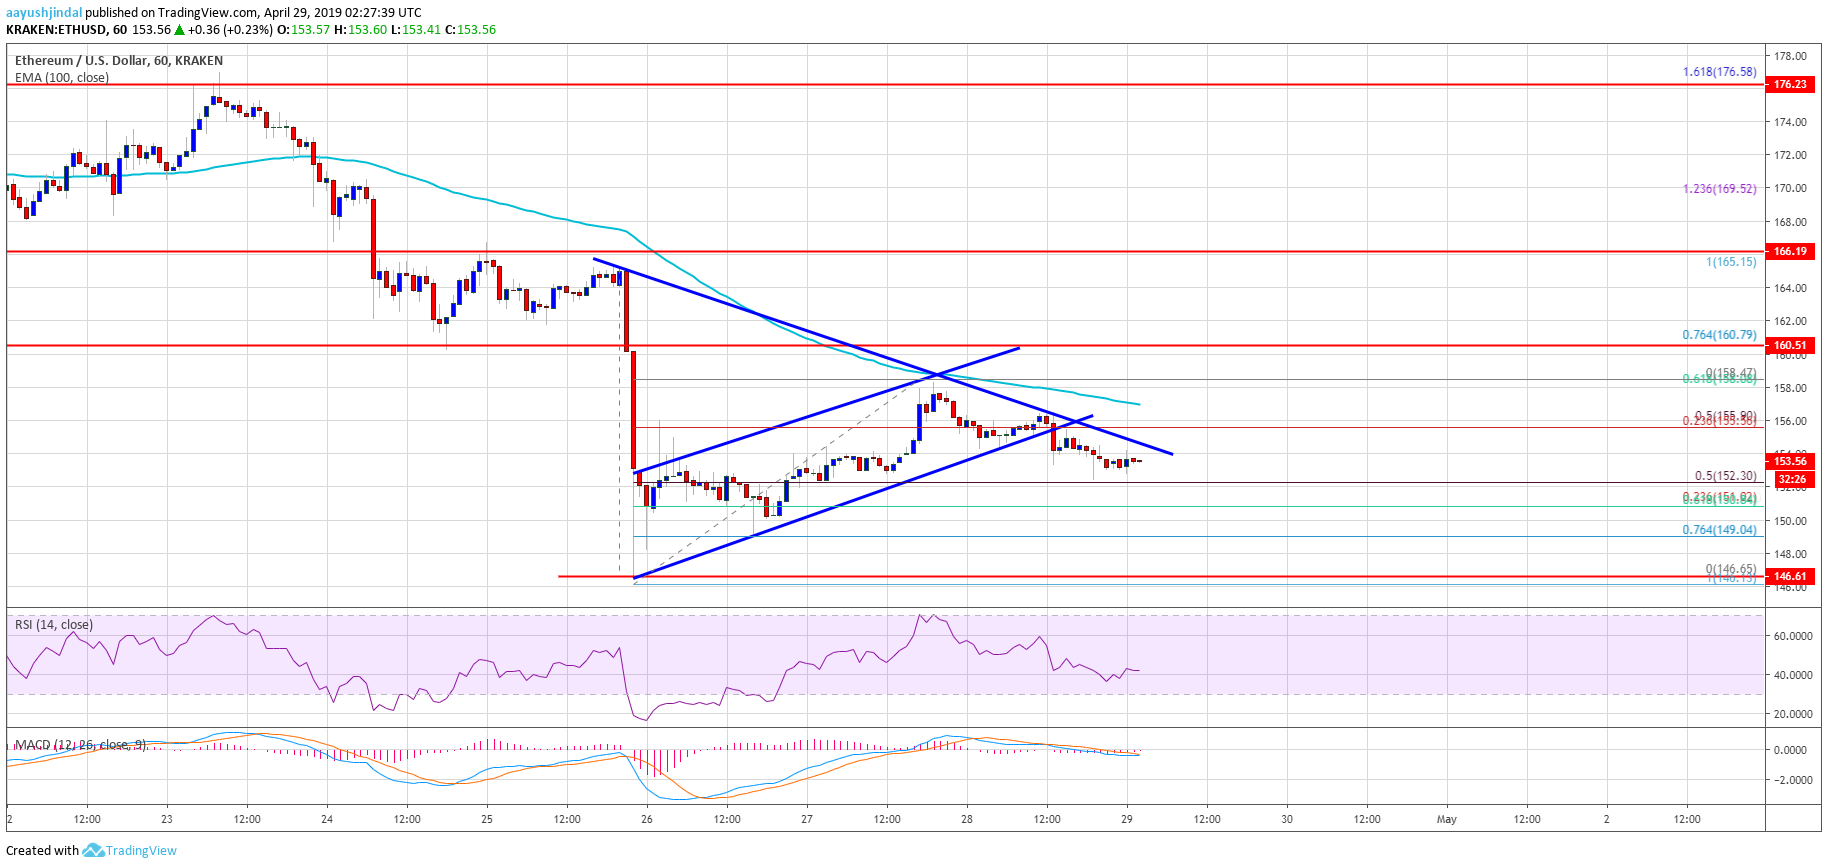
Looking at the chart, Ethereum price is clearly facing a lot of hurdles near the $155 and $156 levels. If there is a successful close above the $156 level and the 100 hourly SMA, the bears may step back in the short term. If not, there is a risk of a sharp decline towards the $146 or $142 level.
ETH Technical Indicators
Hourly MACD – The MACD for ETH/USD is slowly moving back in the bearish zone.
Hourly RSI – The RSI for ETH/USD is currently rebounding higher towards the 45 and 50 levels.
Major Support Level – $150
Major Resistance Level – $156