- ETH price started a strong rally above the $150 and $160 resistance levels against the US Dollar.
- The price rallied recently and even climbed above the $170 resistance area.
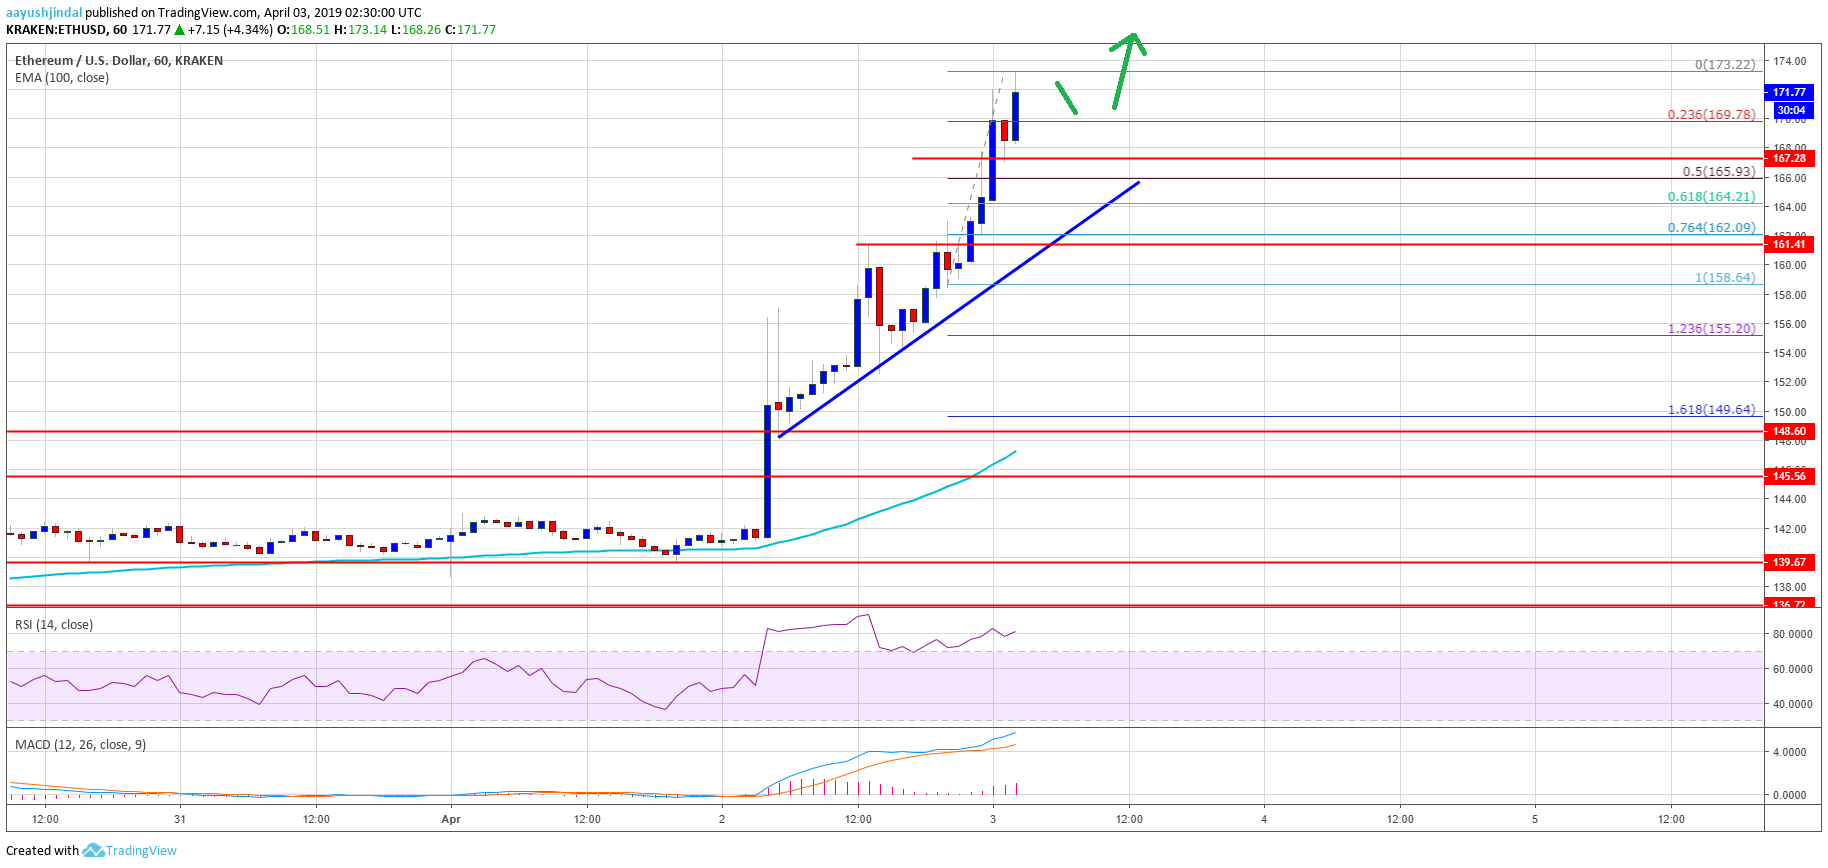
- There is a crucial bullish trend line formed with support at $165 on the hourly chart of ETH/USD (data feed via Kraken).
- The pair remains in a strong uptrend and it might continue to rise towards the $180 resistance level.
Ethereum price surged more than 25% versus the US Dollar, coupled with bitcoin price rally. ETH is now trading well above the $165 level and it could accelerate towards the $200 barrier.
Ethereum Price Analysis
Yesterday, we saw a nasty upward move in bitcoin above the $4,800 resistance. It helped ETH price in clearing the $150 and $155 resistances against the US Dollar. The ETH/USD pair jumped more than 25% in the past few sessions. Bulls took control, resulting in a sharp upward move above the $160 and $165 resistance levels. The price even rallied above the $170 resistance and settled well above the 100 hourly simple moving average.
A new yearly high was formed near $173 and the price is still trading with a bullish angle. An initial support is near the $170 level. It represents the 23.6% Fib retracement level of the recent rise from the $159 swing low to $173 swing high. There is also a crucial bullish trend line formed with support at $165 on the hourly chart of ETH/USD. The trend line coincides with the 50% Fib retracement level of the recent rise from the $159 swing low to $173 swing high.
The current price action is very positive, suggesting more gains above the $172 and $173 levels. Buyers could even target the $180 resistance, which is a strong barrier. The next key resistance is near the $185 level, above which the final target in the current wave could be $200. The overall rally is gathering momentum above $165 and sellers are likely to struggle in the coming sessions.

Looking at the chart, Ethereum price is placed in a strong uptrend above the $160 and $165 pivot levels. The price is already up more than 25%, with Ethereum supporters in full action. Therefore, dips towards the $165 and $160 levels are likely to find a solid buying interest. On the upside, a break above the $180 level could open the doors for more gains towards $200.
ETH Technical Indicators
Hourly MACD – The MACD for ETH/USD is gaining pace in the bullish zone, with a positive bias.
Hourly RSI – The RSI for ETH/USD is currently well above the 80 level, with a bullish angle.
Major Support Level – $165
Major Resistance Level – $180


