
Reason to trust
How Our News is Made
Strict editorial policy that focuses on accuracy, relevance, and impartiality
Ad discliamer
Morbi pretium leo et nisl aliquam mollis. Quisque arcu lorem, ultricies quis pellentesque nec, ullamcorper eu odio.
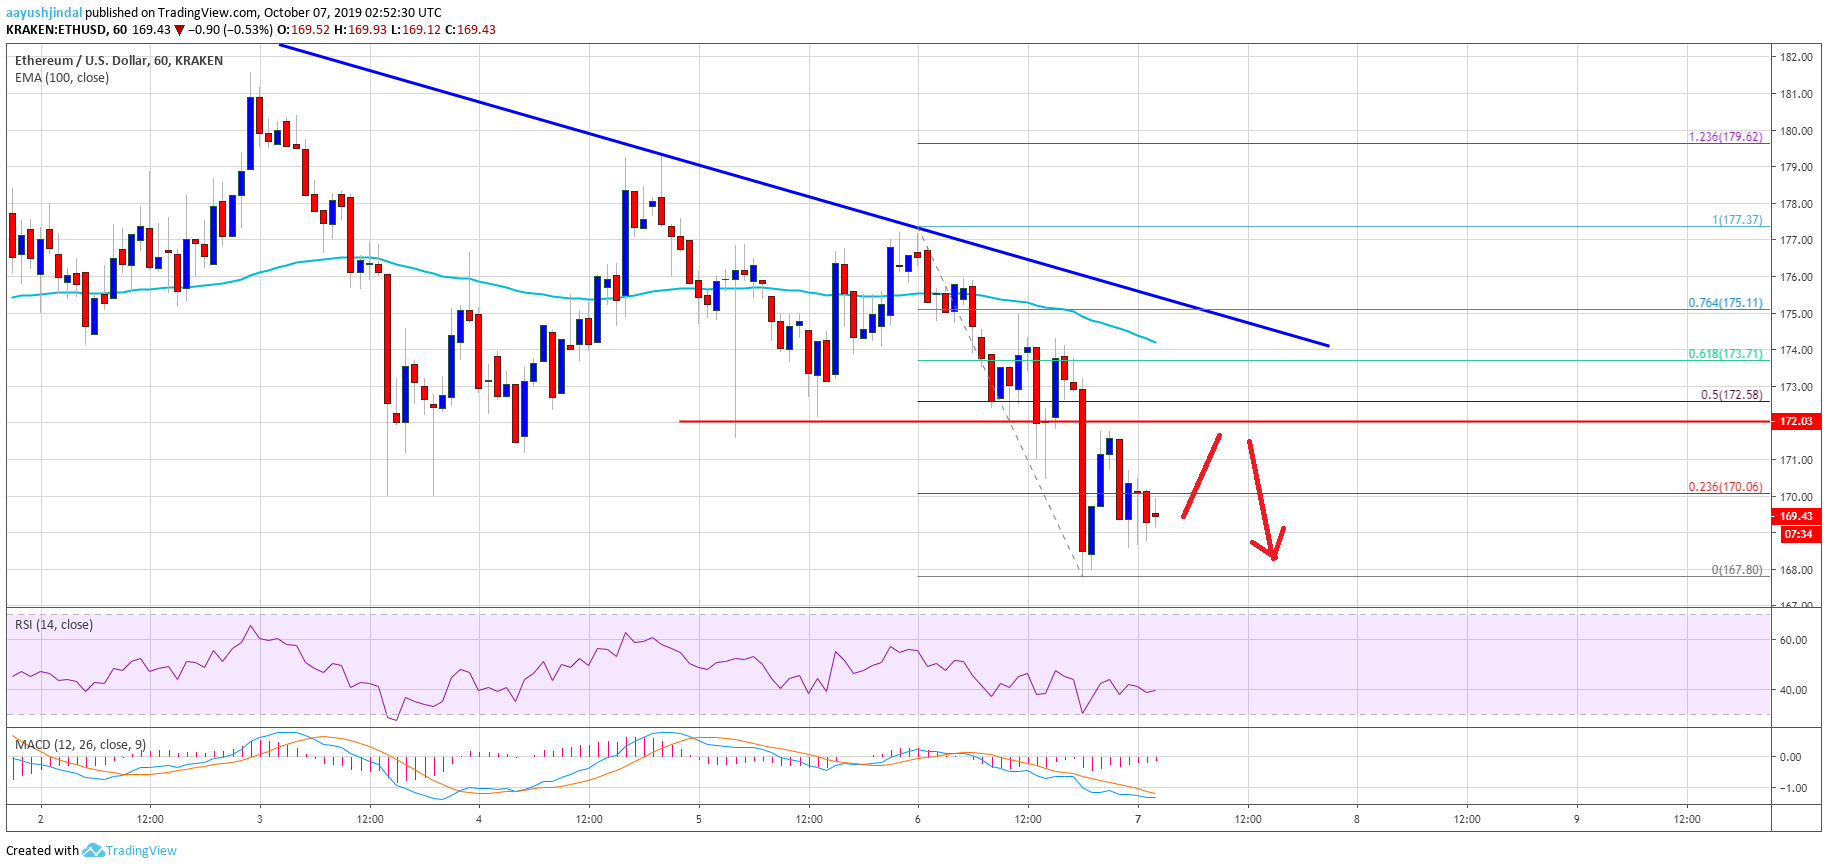
- ETH price is declining and it recently broke the $172 and $170 support levels against the US Dollar.
- The price is trading in a bearish zone and it could slide further towards the $160 support.
- There is a major bearish trend line forming with resistance near $174 on the hourly chart of ETH/USD (data feed via Kraken).
- The pair might correct a few points higher, but upsides might be capped near $172 and $175.
Ethereum price is showing bearish signs versus the US Dollar, while bitcoin is declining. ETH price might continue to move down and it could test $160.
Ethereum Price Analysis
Recently, Ethereum failed to surpass the $180 resistance area against the US Dollar. As a result, ETH price started a fresh decline below the $175 support area. Moreover, there was a close below the $175 support and the 100 hourly simple moving average. The price even broke the $172 and $170 support levels. A new weekly low was formed near $167 and the price is currently consolidating losses.
An immediate resistance is near the $170 level. It coincides with the 23.6% Fib retracement level of the recent decline from the $177 high to $167 low. The main hurdles for the bulls are near the $172 and $175 levels. Moreover, there is a major bearish trend line forming with resistance near $174 on the hourly chart of ETH/USD. An intermediate resistance is near the 50% Fib retracement level of the recent decline from the $177 high to $167 low.
Therefore, an upside correction from the current levels might face sellers near the $172 and $175 levels. A successful close above the $175 level and the 100 hourly SMA could open the doors for a recovery towards the $180 and $185 resistance levels.
If there is no recovery above $175, the price might continue to move down. An immediate support is near the $165 level. A downside break below the $165 support could set the pace for a drop towards the $160 support area in the near term.
Looking at the chart, Ethereum price is clearly trading in a bearish zone below the $175 level and the 100 hourly SMA. To recover, the price must settle above the $175 pivot level. If not, there is a risk of a downside break below the $165 and $160 support levels. The main support is near the $155 and $154 levels.
ETH Technical Indicators
Hourly MACD – The MACD for ETH/USD is slowly reducing its bearish slope.
Hourly RSI – The RSI for ETH/USD is currently near the 40 level, with no major positive signs.
Major Support Level – $165
Major Resistance Level – $175