
Reason to trust
How Our News is Made
Strict editorial policy that focuses on accuracy, relevance, and impartiality
Ad discliamer
Morbi pretium leo et nisl aliquam mollis. Quisque arcu lorem, ultricies quis pellentesque nec, ullamcorper eu odio.
Ethereum is gaining bullish momentum and it recently tested the $250 resistance against the US Dollar. ETH price is likely to continue higher above the $255 and $260 resistance levels.
- Ethereum is showing a lot of positive signs above the $240 level.
- The price is currently struggling to gain bullish momentum above the $250 resistance zone.
- There is a key bullish trend line forming with support near $242 on the hourly chart of ETH/USD (data feed via Kraken).
- The pair is likely to accelerate higher above the $255 and $260 levels in the near term.
Ethereum Price Gaining Traction
Yesterday, we discussed the chances of Ethereum price testing the $250 resistance. ETH price did gain bullish momentum above the $245 level and tested the $250 resistance zone.
A high is formed near $251 and the price is trading well above the 100 hourly simple moving average. It is currently struggling to gain strength above the $250 and $252 levels.
Ether price tested the 23.6% Fib retracement level of the recent wave from the $235 low to $251 high. The first major support on the downside is seen near the $242 level. There is also a key bullish trend line forming with support near $242 on the hourly chart of ETH/USD.
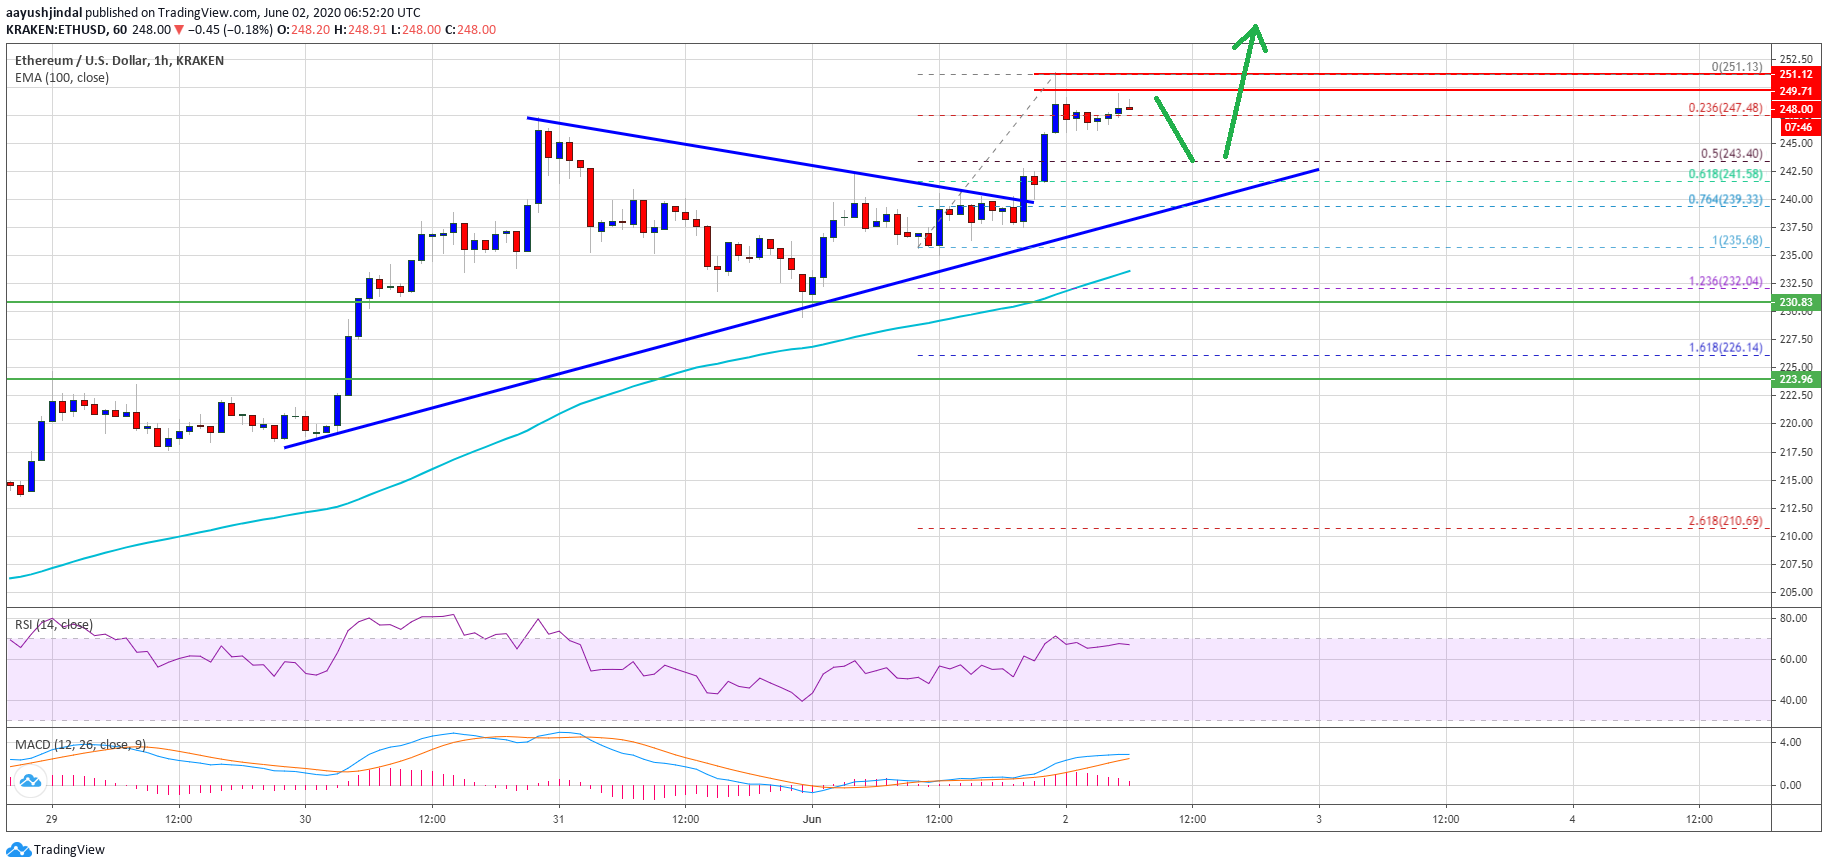
The trend line is close to the 50% Fib retracement level of the recent wave from the $235 low to $251 high. If there is a downside break below the trend line support, there is a risk of more downsides below the $240 level.
On the upside, Ethereum must gain momentum above the $250 resistance zone. An immediate resistance is near the $255 level. The next major resistance is near the $265 level.
Any further gains could start a strong upward move and the price might surpass the $275 resistance to test $282 or even $295 in the coming days.
Downsides Could Be Limited in ETH
If Ethereum starts a downside correction, it is likely to find bids near the $242 and $240 levels. The next major support is seen near the $235 level.
Any further losses may perhaps lead the price towards the $232 support zone or the 100 hourly SMA, where the bulls are likely to take a stand.
Technical Indicators
Hourly MACD – The MACD for ETH/USD is losing momentum in the bullish zone.
Hourly RSI – The RSI for ETH/USD is now well above the 60 level, with a positive bias.
Major Support Level – $242
Major Resistance Level – $255
Take advantage of the trading opportunities with Plus500
Risk disclaimer: 76.4% of retail CFD accounts lose money.