
Reason to trust
How Our News is Made
Strict editorial policy that focuses on accuracy, relevance, and impartiality
Ad discliamer
Morbi pretium leo et nisl aliquam mollis. Quisque arcu lorem, ultricies quis pellentesque nec, ullamcorper eu odio.
- Ethereum is correcting lower from $135 and it is trading above $125 against the US Dollar.
- The price is likely to remain in a positive zone as long as it is above $120.
- There is a breakout pattern forming with resistance near $128 on the hourly chart of ETH/USD (data feed via Kraken).
- Bitcoin is showing green signals as it settled nicely above the $7,000 resistance area.
Ethereum price is consolidating above $125 versus the US Dollar, similar to bitcoin above $7,000. ETH price might dip a few points, but it could surge again as long as above $120.
Ethereum Price Analysis
Recently, we saw a sharp recovery wave in Ethereum from the $115 monthly low against the US Dollar. ETH price rallied above the $120 and $125 resistance levels.
Moreover, there was a break above the $130 resistance and the 100 hourly simple moving average. Similarly, bitcoin price climbed sharply above $6,800 and settled above the $7,000 level.
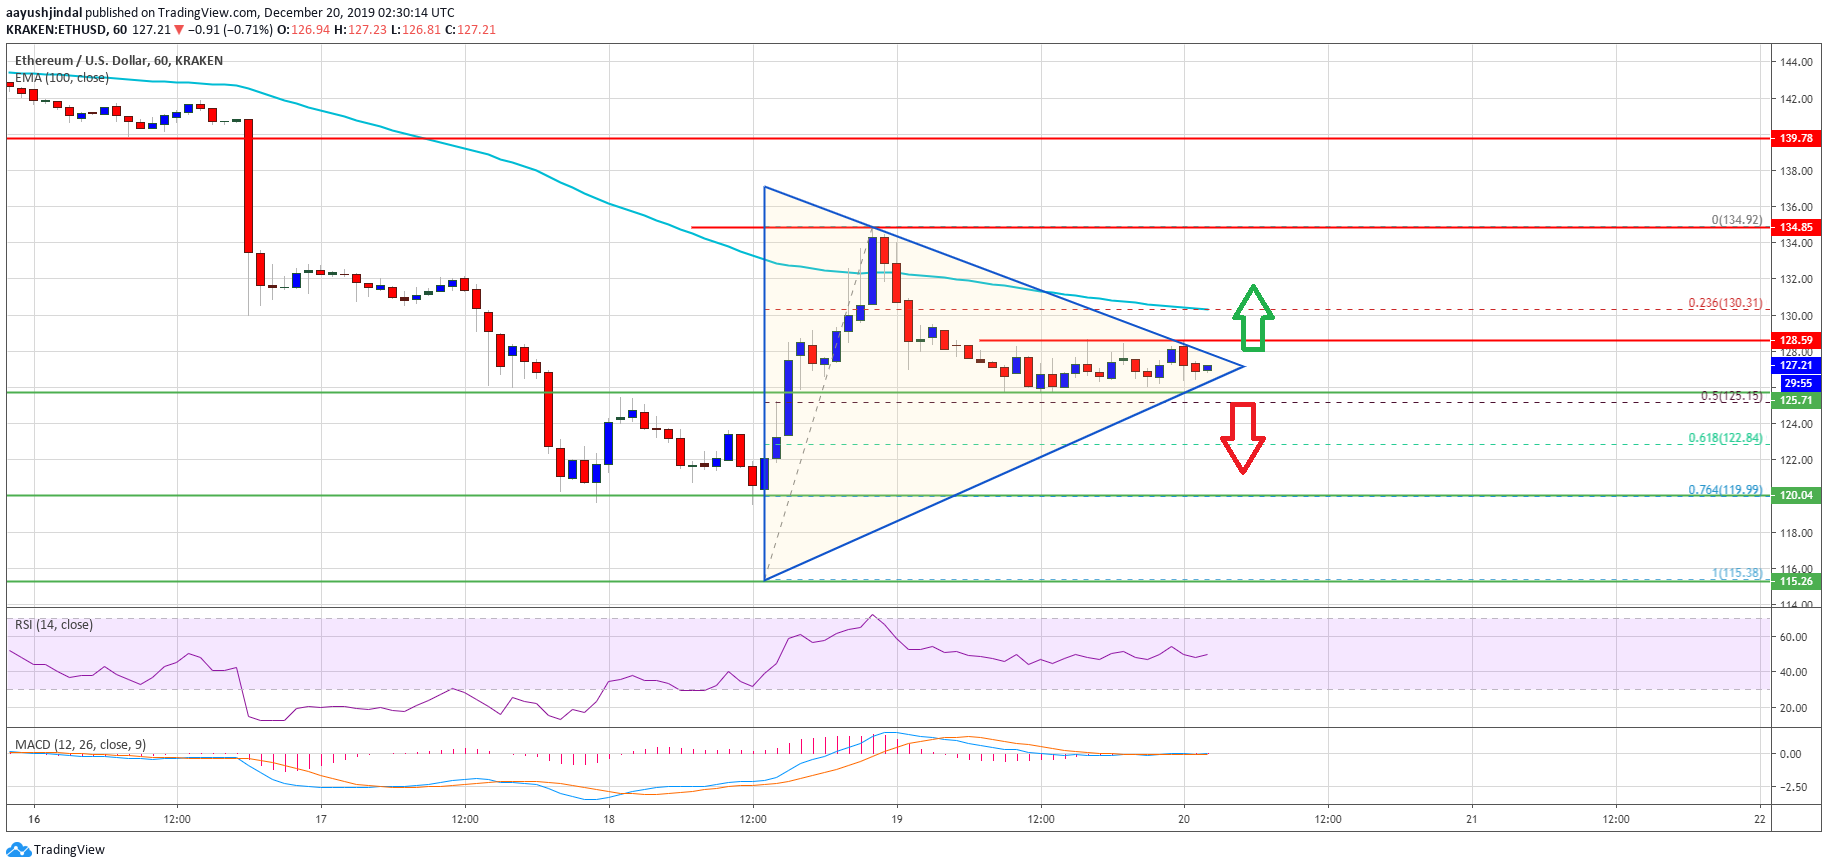
Ethereum traded as high as $135 and recently started a downside correction. It traded below $130 and the 100 hourly SMA. Besides, there was a break below the 23.6% Fib retracement level of the recent jump from the $115 low to $135 high.
However, the price seems to be finding bids near the $126 and $125 levels. More importantly, the 50% Fib retracement level of the recent jump from the $115 low to $135 high is near the $125 level.
At the moment, there is a breakout pattern forming with resistance near $128 on the hourly chart of ETH/USD. The pair is likely preparing for the next break either above $128 or below $125.
If there is an upside break above $128, the price could test $130 and the 100 hourly SMA. Additionally, a close above the $130 level could start another increase towards the $135 resistance area.
Conversely, the price might spike below the $126 and $125 support levels. In this case, the $120 support holds a lot of importance. As long as there is no close below $120, the price could bounce back. If not, the price is likely to resume its downtrend below the $115 low in the near term.
Looking at the chart, Ethereum price is clearly consolidating above the key $125 support. In the short term, there could be a downside spike below $125, but the price might bounce back. Similarly, bitcoin price remains well bid above $7,000 and $6,960.
ETH Technical Indicators
Hourly MACD – The MACD for ETH/USD is currently in the neutral zone.
Hourly RSI – The RSI for ETH/USD is just below the 50 level, with positive signs.
Major Support Level – $125
Major Resistance Level – $130


