
Reason to trust
How Our News is Made
Strict editorial policy that focuses on accuracy, relevance, and impartiality
Ad discliamer
Morbi pretium leo et nisl aliquam mollis. Quisque arcu lorem, ultricies quis pellentesque nec, ullamcorper eu odio.
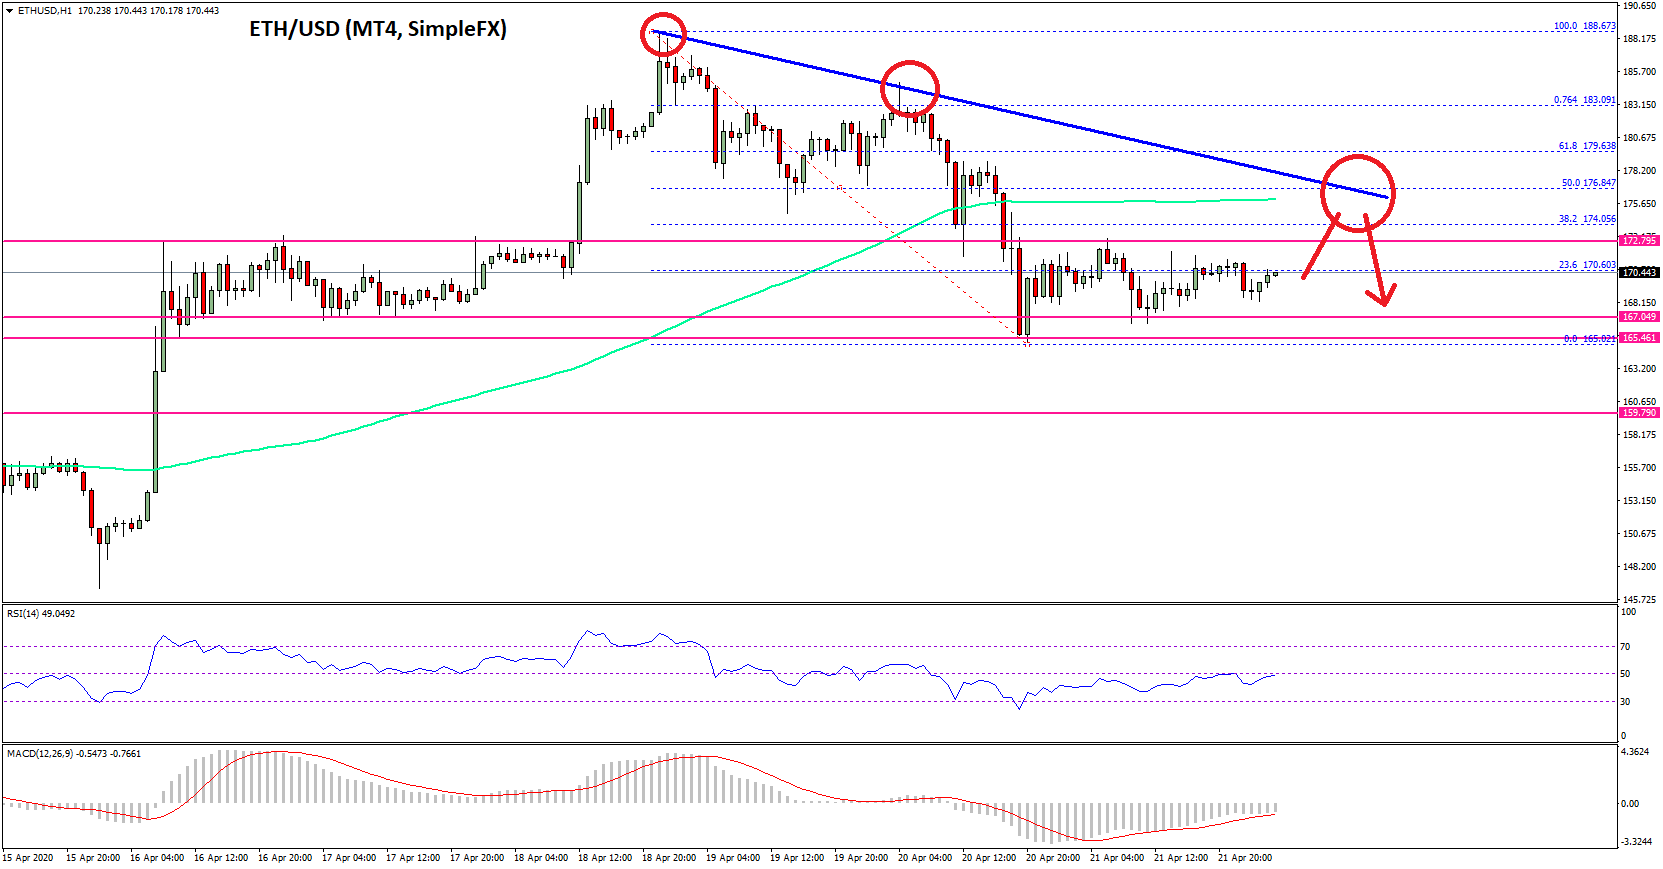
Ethereum is down more than 10% from the $190 swing high against the US Dollar. ETH price is currently consolidating above $165 and facing key hurdles near the 100 hourly SMA.
- Ethereum declined sharply below the $175 support and tested the $165 zone.
- The price is currently consolidating losses and it might correct towards $175.
- There is a key bearish trend line forming with resistance near $176 on the hourly chart of ETH/USD (data feed via SimpleFX).
- The pair is likely to struggle near the $176 resistance and the 100 hourly simple moving average.
Ethereum Price Facing Hurdles
In the past few sessions, there was a steady decline in Ethereum from well above the $185 level against the US Dollar. ETH price traded below the key $175 support and the 100 hourly simple moving average.
It tested the $165 support area and it is currently consolidating losses. There was a minor upward move above the 23.6% Fib retracement level of the key decline from the $189 monthly high to $165 low.
On the upside, an initial resistance is near the $173 level (the recent breakdown zone). The first major hurdle for the bulls is see near the $175 level since it is close to the 100 hourly simple moving average.
More importantly, there is a key bearish trend line forming with resistance near $176 on the hourly chart of ETH/USD. The trend line coincides with the 50% Fib retracement level of the key decline from the $189 monthly high to $165 low.
If Ethereum starts an upside correction above the $173 level, it is likely to face a strong selling interest near the $175 and $176 levels. A successful close above the $175 level and the 100 hourly SMA is needed for more upsides. The next key resistance is near the $180 level, above which Ether price might visit the $189 monthly high.
Bearish Break?
If Ethereum fails to continue above the $175 and $176 resistance levels, it could start a fresh decline. An initial support on the downside is near the $167 level.
The main support is near the $165 level. If there is a convincing break and close below $165, the price may perhaps extend its decline towards the $160 support or the $158 pivot level in the near term.
Technical Indicators
Hourly MACD – The MACD for ETH/USD is currently reducing its last bearish slope
Hourly RSI – The RSI for ETH/USD is struggling to move back above the 50 level.
Major Support Level – $165
Major Resistance Level – $176
Image from unsplash