
Reason to trust
How Our News is Made
Strict editorial policy that focuses on accuracy, relevance, and impartiality
Ad discliamer
Morbi pretium leo et nisl aliquam mollis. Quisque arcu lorem, ultricies quis pellentesque nec, ullamcorper eu odio.
Ethereum failed to clear the $142 resistance and started a fresh decline against the US Dollar, similar to bitcoin. ETH price could soon test the main $120 support area, where the bulls might emerge.
- ETH price is currently trading in a bearish zone below the $135 level against the US Dollar.
- There are many hurdles on the upside, starting with $135 and up to $144.
- There is a major bearish trend line forming with resistance near $135 on the 4-hours chart of ETH/USD (data feed via Kraken).
- The pair remains in a downtrend as long as it is below $145 and the 100 simple moving average (4-hours).
Ethereum Price Could Extend its Decline
In the past few days, Ethereum made more than two attempts to gain strength above the $140 resistance against the US Dollar. However, ETH price failed to settle above the $140 level and the 100 simple moving average (4-hours).
As a result, a fresh decline initiated below the $136 and $135 support levels. There was a break below the 23.6% Fib retracement level of the upward move from the $108 swing low to $144 swing high.
Ethereum price even broke the $130 support area to move into a bearish zone. It is now trading near the 50% Fib retracement level of the upward move from the $108 swing low to $144 swing high.
On the upside, there is a major bearish trend line forming with resistance near $135 on the 4-hours chart of ETH/USD. If the price fails to stay above the $125 support area, it is likely to extend its decline.
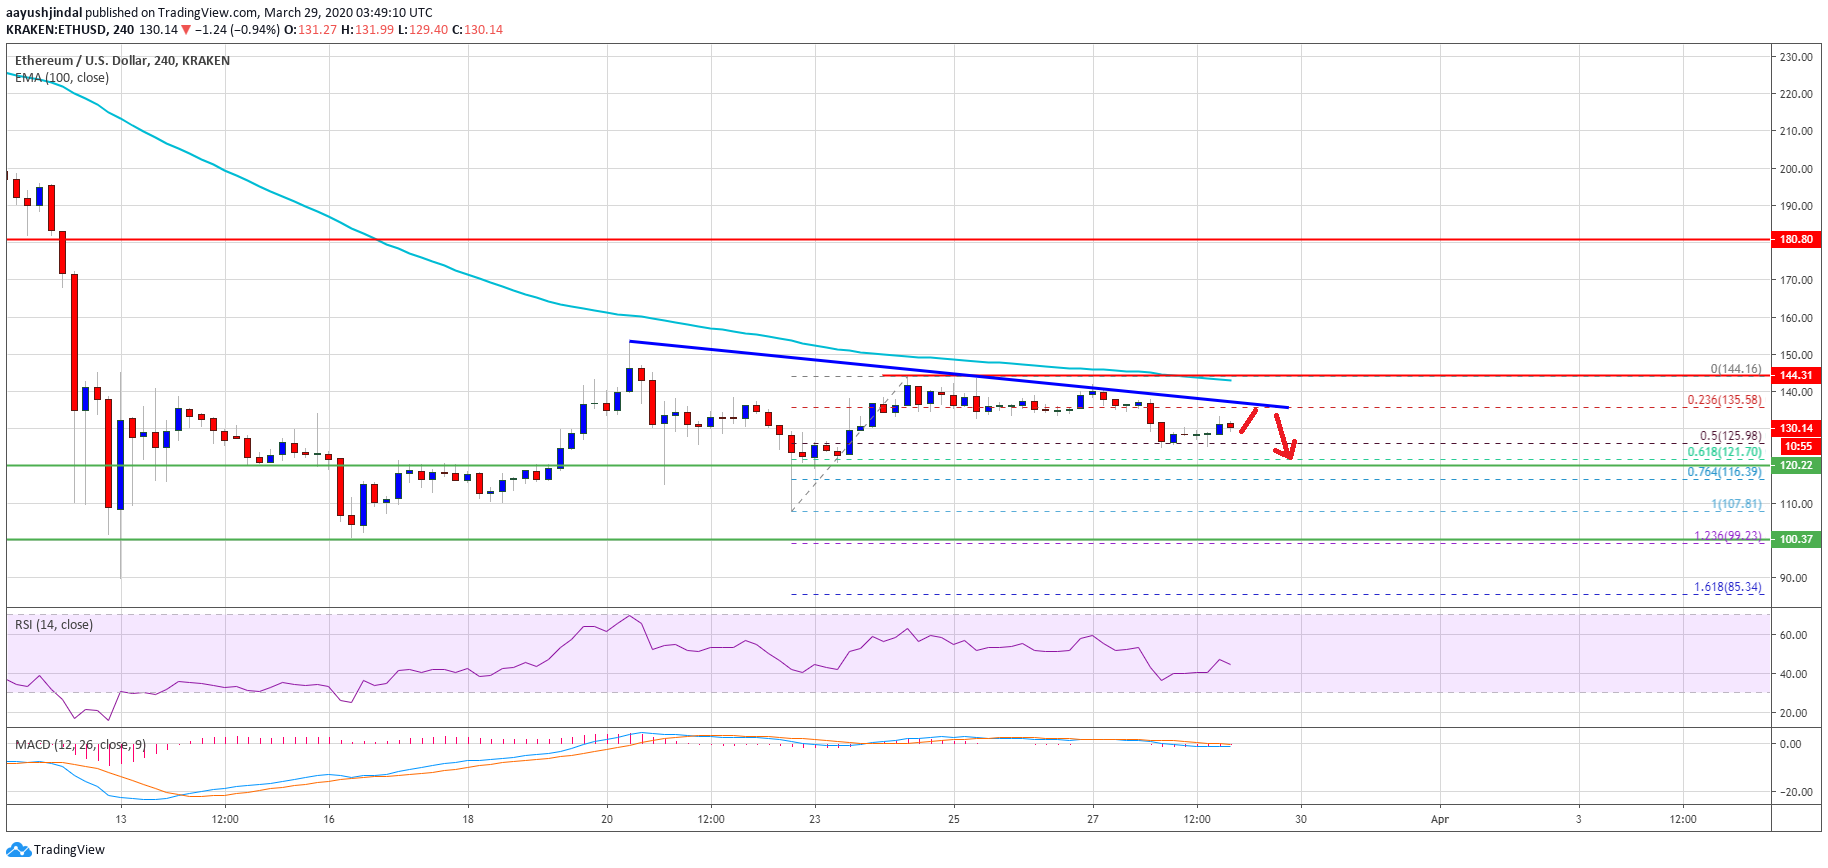
The next key support is near the $120 level, where the bulls are likely to take a stand. Any further losses may perhaps open the doors for a larger decline towards the $105 and $100 support levels in the coming days.
Fresh Increase?
If Ethereum price stays above the $120 support, it could bounce back and start a fresh increase. A clear break above the trend line and the $135 resistance might start an upward move.
The main resistance is still near the $144 level and the 100 simple moving average (4-hours). A successful close above the $144 resistance is needed for a strong rally towards the $155 and $160 levels.
Technical Indicators
4 hours MACD – The MACD for ETH/USD is slowly losing momentum in the bearish zone.
4 hours RSI – The RSI for ETH/USD is now well below the 50 level.
Major Support Level – $120
Major Resistance Level – $144
Take advantage of the trading opportunities with Plus500
Risk disclaimer: 76.4% of retail CFD accounts lose money.


