
Reason to trust
How Our News is Made
Strict editorial policy that focuses on accuracy, relevance, and impartiality
Ad discliamer
Morbi pretium leo et nisl aliquam mollis. Quisque arcu lorem, ultricies quis pellentesque nec, ullamcorper eu odio.
Ethereum is gaining bullish momentum above $375 against the US Dollar. ETH price is showing positive signs and it might even climb above the $385 resistance.
- Ethereum started a fresh upward move after forming a support base near $368.
- The price is now trading well above the $375 level and the 100 hourly simple moving average.
- There was a break above a major bearish trend line with resistance near $372 on the hourly chart of ETH/USD (data feed via Kraken).
- The pair could correct a few points, but there are high chances of more upsides above $385.
Ethereum Price is Gaining Traction
Ethereum started a decent upward move after it formed a strong support base above the $365 level. ETH price broke the $372 pivot level to start the current recovery wave.
The bulls gained strength, resulting in a push above the $375 resistance. Moreover, there was a break above a major bearish trend line with resistance near $372 on the hourly chart of ETH/USD.
Ether price surpassed the 50% Fib retracement level of the downward move from the $385 swing high to $365 swing low. It is now trading well above the $375 level and the 100 hourly simple moving average.
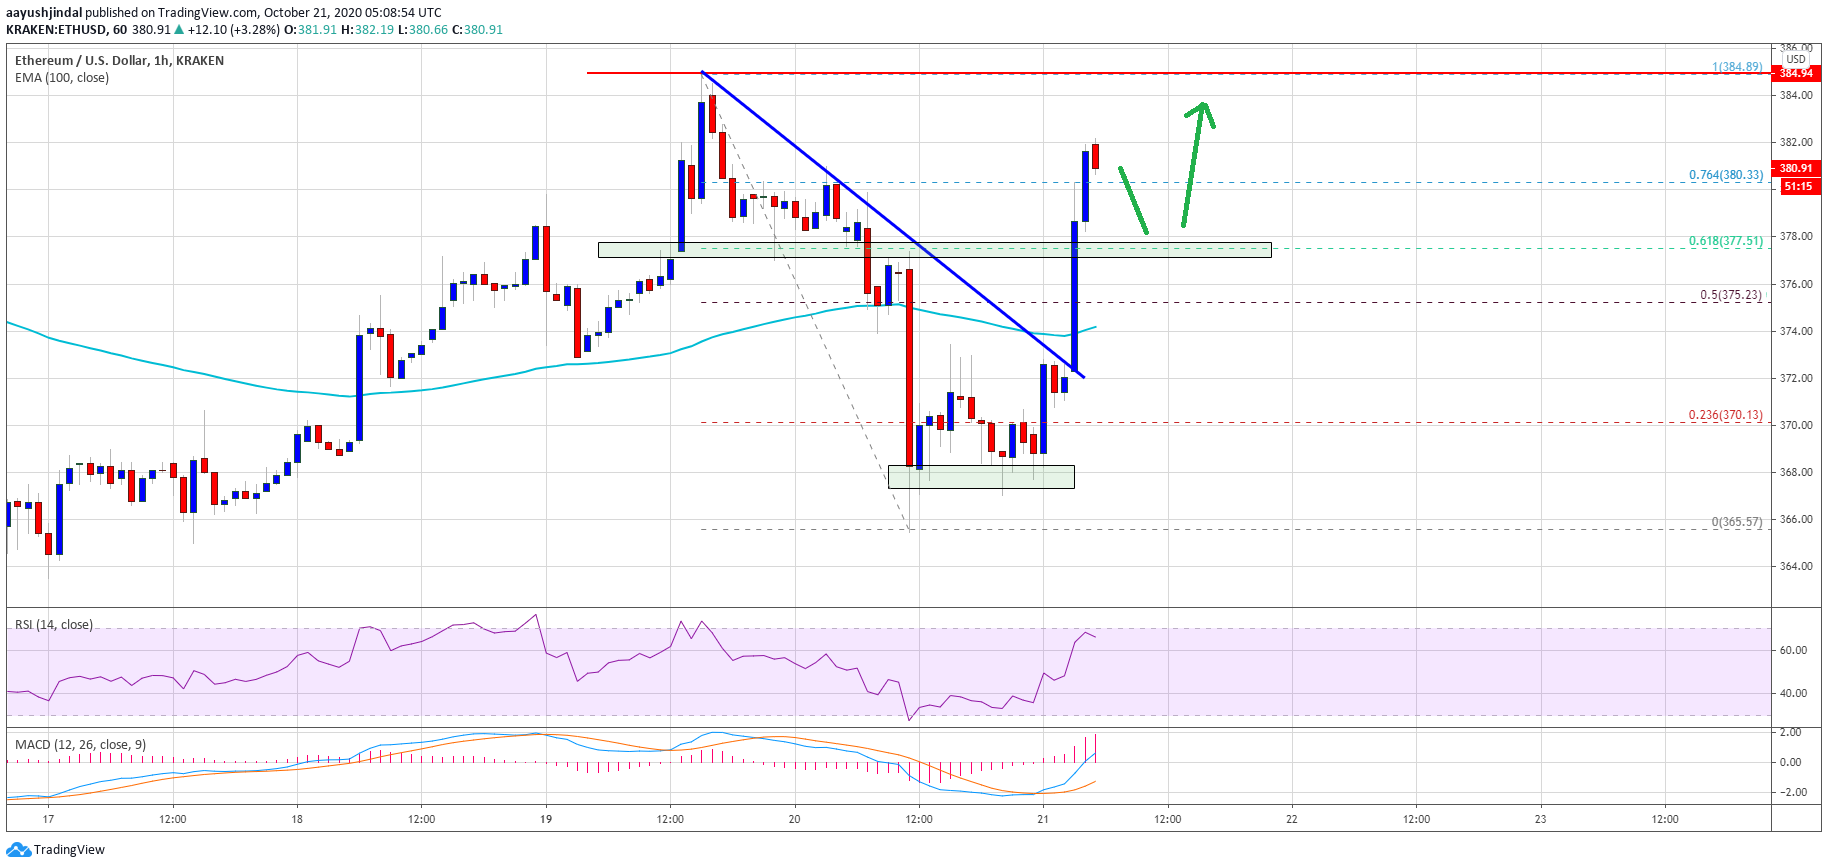
Source: ETHUSD on TradingView.com
The price is also trading above the 76.4% Fib retracement level of the downward move from the $385 swing high to $365 swing low. A high is formed near $382 and the price is clearly gaining momentum. The next immediate resistance is near the $385 swing high, above which ether is likely to accelerate higher (similar to bitcoin).
The next major resistance is near the $392 level. A clear break above the $392 resistance could open the doors for a test of the $400 barrier in the coming sessions.
Downside Break in ETH?
If Ethereum fails to clear the $385 resistance levels, it might start a short-term downside correction. An initial support is near the $378 zone.
The main support is near the broken trend line, $375, and the 100 hourly simple moving average. If ether fails to stay above $375, it could retest the $368 and $365 support levels.
Technical Indicators
Hourly MACD – The MACD for ETH/USD is now gaining pace in the bullish zone.
Hourly RSI – The RSI for ETH/USD is well above the 50 level.
Major Support Level – $375
Major Resistance Level – $385