Key Highlights
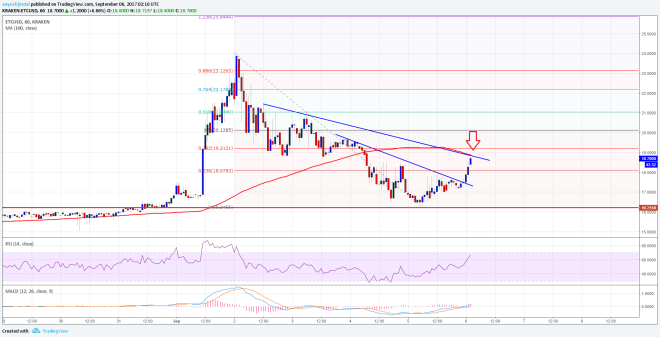
- Ethereum classic price declined sharply towards the $16.20 support against the US Dollar before finding support.
- There is a major bearish trend line forming with resistance at $18.80 on the hourly chart of ETC/USD (Data feed via Kraken).
- The pair needs to break the $18.80-19.00 resistance for further upsides in the near term.
Ethereum classic price is recovering after the recent slide against the US Dollar and Bitcoin. Let’s see if ETC/USD can break $19.00 or not in the near term.
Ethereum Classic Price Resistance
Similar to BCH, BTC and ETH, there was a sharp decline in ETC price towards $16.00 against the US Dollar. The price traded as low as $16.24 where it formed a decent support. After forming support, the price started recovering above $17.00. First, it broke the 23.6% Fib retracement level of the last decline from the $24.00 high to $16.24 low. It cleared the way for more gains above $17.00 in the near term.
Later, there was a break above a major bearish trend line with resistance at $17.50 on the hourly chart of ETC/USD. At the moment, the pair is approaching another bearish trend line with resistance at $18.80 on the same chart. The $18.80 resistance is very important since the 100 hourly simple moving average is near the stated level. Moreover, the 38.2% Fib retracement level of the last decline from the $24.00 high to $16.24 low is also near $19.20. Therefore, it won’t be easy for buyers to crack the $18.80-19.00 resistance in the short term.
Once there is a break, the price could test the 50% Fib retracement level of the last decline from the $24.00 high to $16.24 low at $20.10.
Hourly MACD – The MACD has moved back in the bullish zone.
Hourly RSI – The RSI is moving sharply higher towards the overbought levels.
Major Support Level – $17.50
Major Resistance Level – $18.80
Charts courtesy – Trading View, Kraken


