
Reason to trust
How Our News is Made
Strict editorial policy that focuses on accuracy, relevance, and impartiality
Ad discliamer
Morbi pretium leo et nisl aliquam mollis. Quisque arcu lorem, ultricies quis pellentesque nec, ullamcorper eu odio.
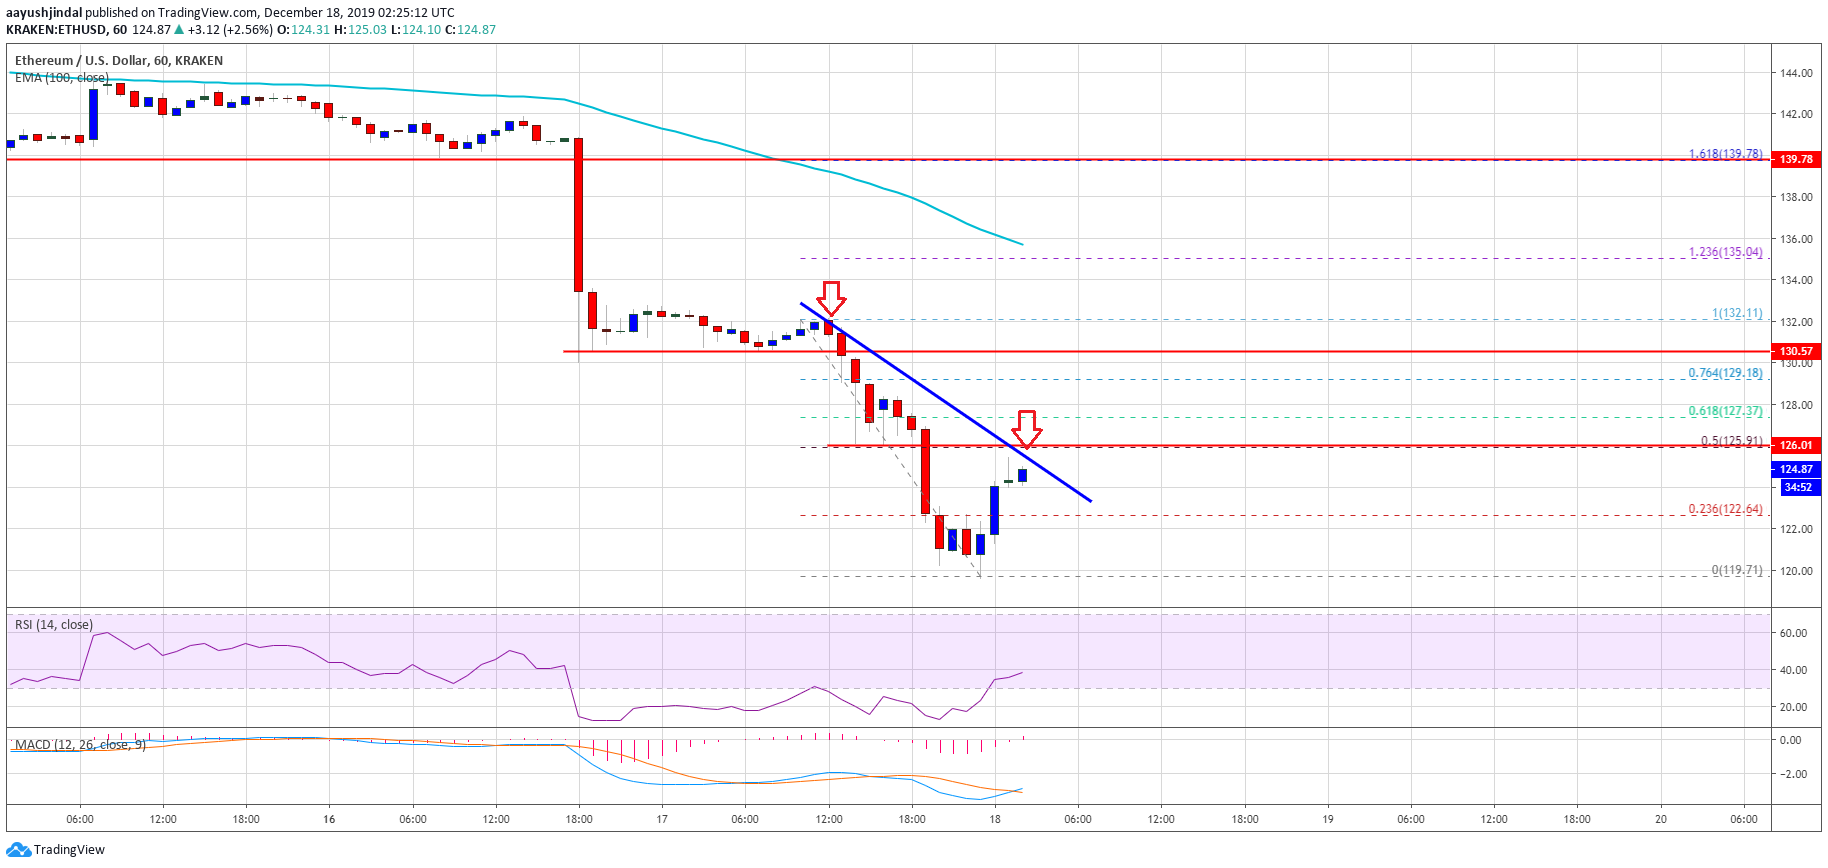
- Ethereum is down 5% again today and it broke the $130 support area against the US Dollar.
- The price is now trading near key support levels such as $120 and $122.
- There is a short term bearish trend line forming with resistance near $126 on the hourly chart of ETH/USD (data feed via Kraken).
- The price could start a decent recovery towards $130 or even $135 as long as it is above $120.
- Similarly, bitcoin dived more than 4% and tested the $6,600-$6,500 support area.
Ethereum price is trading near major supports after a strong decline versus the US Dollar, similar to bitcoin. ETH price must stay above $120 to start a solid recovery.
Ethereum Price Analysis
There were additional losses witness in Ethereum below the $130 support area against the US Dollar. It seems like all bearish targets as discussed in the weekly forecast for ETH price were achieved such as $132 and $125.
Moreover, the price gained bearish momentum below the $125 support and settled well below the 100 hourly simple moving average. It opened the doors for more losses and the price traded towards the key $122 and $120 support levels.
A new monthly low was formed near $120 and the price is currently correcting higher. Ethereum already surpassed the 23.6% Fib retracement level of the recent slide from the $132 high to $120 low.
However, the price is now approaching the $125-$126 resistance area. Besides, there is a short term bearish trend line forming with resistance near $126 on the hourly chart of ETH/USD.
The trend line is close to the 50% Fib retracement level of the recent slide from the $132 high to $120 low. Therefore, the price must surpass the $125-$126 resistance zone to recover further.
The next major resistance could be near the $130 level (the recent breakdown support). If there are any additional gains, the bulls are likely to target the $135 resistance area and the 100 hourly simple moving average.
Conversely, the bulls might struggle to clear the $125-$126 resistance area. In the mentioned case, there is a risk of a fresh decline below the $120 support area in the near term.
Looking at the chart, Ethereum price is holding the $120 support and correcting higher. Having said that, the bears are still in control unless the bulls make an effort to push the price back above $126 and $130 to start a recovery.
ETH Technical Indicators
Hourly MACD – The MACD for ETH/USD is about to move into the bullish zone.
Hourly RSI – The RSI for ETH/USD is currently correcting higher and moving towards the 40 level.
Major Support Level – $120
Major Resistance Level – $126


