Reason to trust
How Our News is Made
Strict editorial policy that focuses on accuracy, relevance, and impartiality
Ad discliamer
Morbi pretium leo et nisl aliquam mollis. Quisque arcu lorem, ultricies quis pellentesque nec, ullamcorper eu odio.
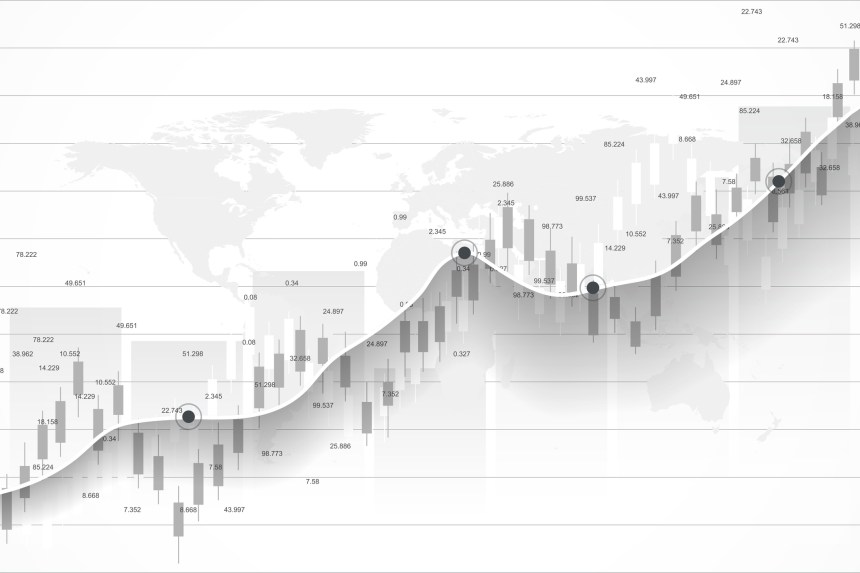
Polkadot (DOT) is gaining pace above the $5.25 resistance against the US Dollar. The price could surge further toward the $5.85 and $6.00 levels.
- DOT is gaining pace above the $5.25 resistance zone against the US Dollar.
- The price is trading above the $5.30 zone and the 100 simple moving average (4 hours).
- There is a key bearish trend line forming with resistance near $5.55 on the 4-hour chart of the DOT/USD pair (data source from Kraken).
- The pair could gain bullish momentum if there is a close above $5.55 and $5.60.
Polkadot Price Regains Strength
After consolidating above the $5.00 support, DOT price started a decent increase. The price was able to clear the $5.20 and $5.25 resistance levels to move into a positive zone, like Bitcoin and Ethereum.
Polkadot cleared the 100 simple moving average (4 hours) and tested the $5.60 resistance. A high is formed near $5.58 and the price is now consolidating gains. It is up nearly 5% and shows signs of more gains in the coming sessions.
DOT price is now trading above the $5.30 zone and the 100 simple moving average (4 hours). Immediate resistance is near the $5.55 level. There is also a key bearish trend line forming with resistance near $5.55 on the 4-hour chart of the DOT/USD pair.

Source: DOTUSD on TradingView.com
The next major resistance is near $5.60. A successful break above $5.60 could start another strong rally. In the stated case, the price could easily rally toward $5.85 in the near term. The next major resistance is seen near the $6.00 zone.
Are Dips Supported in DOT?
If DOT price fails to continue higher above $5.55 or $5.60, it could start a downside correction. The first key support is near the $5.35 level.
The next major support is near the $5.30 level or the 61.8% Fib retracement level of the upward move from the $5.11 swing low to the $5.58 high, below which the price might decline to $5.10. Any more losses may perhaps open the doors for a move toward the $5.00 support zone.
Technical Indicators
4-Hours MACD – The MACD for DOT/USD is now gaining momentum in the bullish zone.
4-Hours RSI (Relative Strength Index) – The RSI for DOT/USD is now above the 50 level.
Major Support Levels – $5.30, $5.10 and $5.00.
Major Resistance Levels – $5.55, $5.60, and $6.00.