
Reason to trust
How Our News is Made
Strict editorial policy that focuses on accuracy, relevance, and impartiality
Ad discliamer
Morbi pretium leo et nisl aliquam mollis. Quisque arcu lorem, ultricies quis pellentesque nec, ullamcorper eu odio.
Polkadot’s DOT started a fresh increase above the $6.50 resistance against the US Dollar. The price is now correcting gains, but dips might be limited below $6.80.
- DOT is correcting gains from the $7.85 resistance zone against the US dollar.
- The price is trading above the $6.60 support and the 100 simple moving average (4-hours).
- There was a break above a major bearish trend line with resistance near $6.75 on the 4-hours chart of the DOT/USD pair (data source from Kraken).
- The pair could find a strong buying interest near $6.80 and $6.60 in the near term.
Polkadot’s DOT Price Corrects Lower
After forming a base above the $6.00 zone, DOT price started a fresh increase. It climbed above the $6.40 and $6.50 levels to move back into a positive zone.
The bulls were able to push the price above the $6.80 level and the 100 simple moving average (4-hours). Besides, there was a break above a major bearish trend line with resistance near $6.75 on the 4-hours chart of the DOT/USD pair.
The pair traded to a new multi-week high at $7.89 before the bears appeared. The price started a downside correction below the $7.50 level, similar to bitcoin and ethereum. It declined below the 23.6% Fib retracement level of the upward move from the $5.88 swing low to $7.89 high.
However, DOT price is trading above the $6.60 support and the 100 simple moving average (4-hours). An immediate resistance is near the $7.40 level.
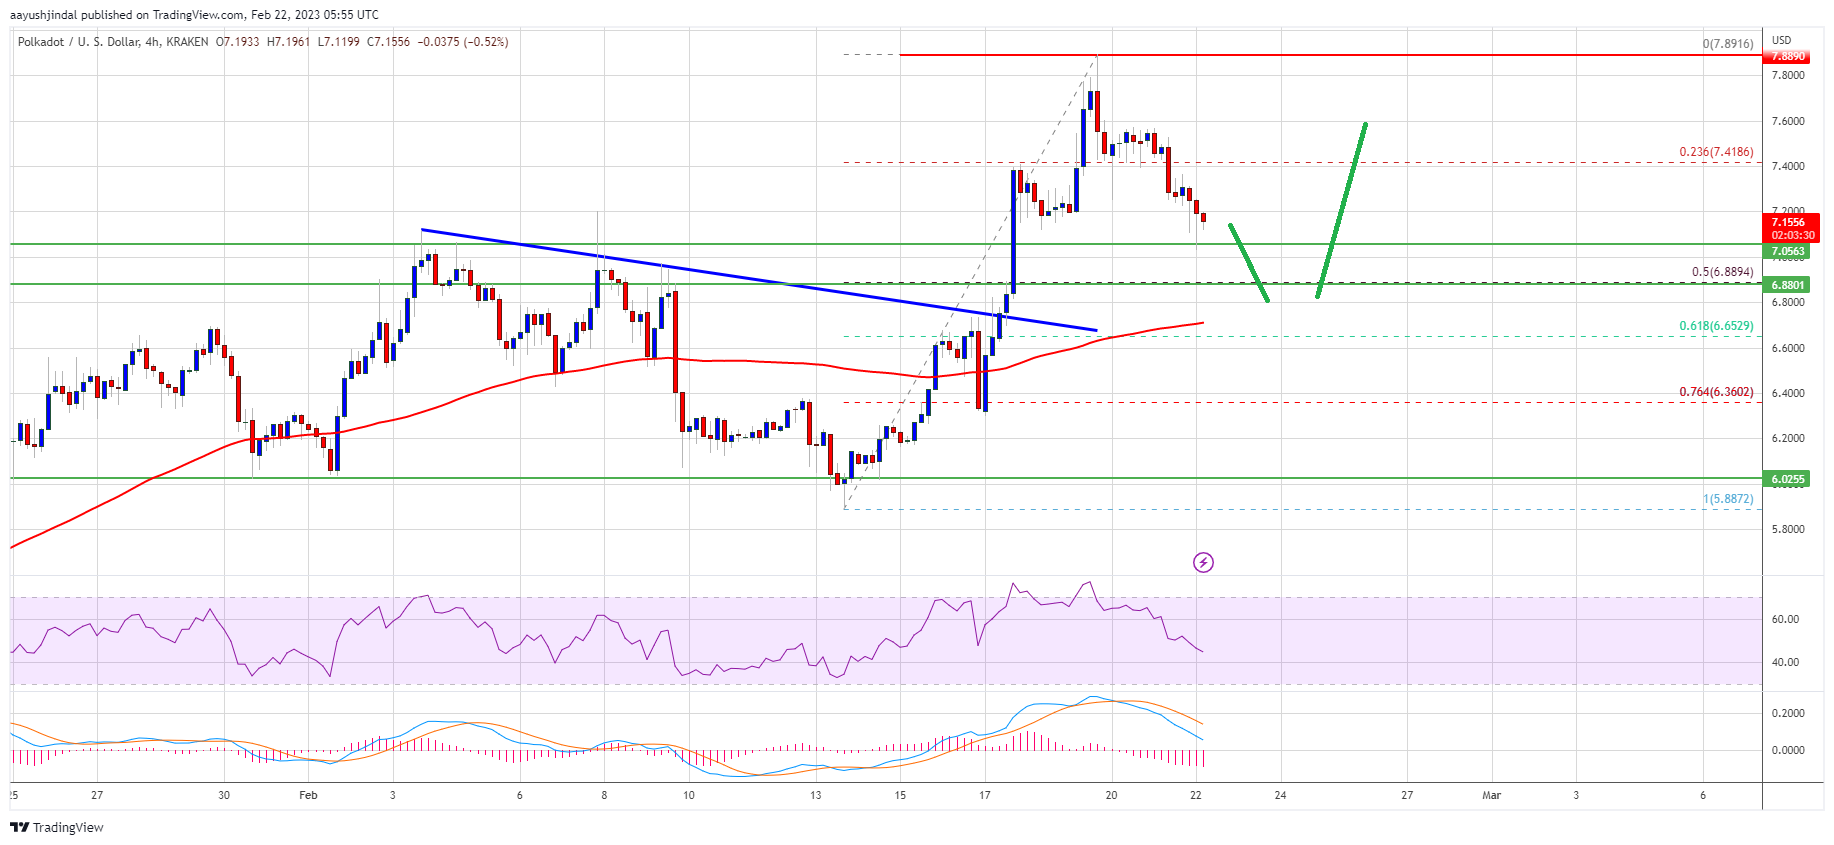
Source: DOTUSD on TradingView.com
The main resistance is near the $7.80 and $7.85 levels. A successful break above $7.80 and a close above $7.80 could start a strong rally. In the stated case, the price could easily rally towards $8.50 or even $9.20 in the coming sessions.
Dips Limited?
If DOT price fails to continue higher above $7.20 or $7.40, it could continue to move down. The first key support is near the $7.00 level. The next major support is near the $6.80 level and the 100 simple moving average (4-hours).
It is close to the 50% Fib retracement level of the upward move from the $5.88 swing low to $7.89 high, below which the price might decline to $6.60. Any more losses may perhaps open the doors for a move towards the $6.00 support zone.
Technical Indicators
4-Hours MACD – The MACD for DOT/USD is now gaining momentum in the bearish zone.
4-Hours RSI (Relative Strength Index) – The RSI for DOT/USD is now below the 50 level.
Major Support Levels – $7.00, $6.80 and $6.60.
Major Resistance Levels – $7.20, $7.40 and $7.80.