Dogecoin price traded yesterday between 56 and 62 satoshis, which points to the relative stability of dogecoin price in the face of the high volatility of other cryptocurrencies at the moment.
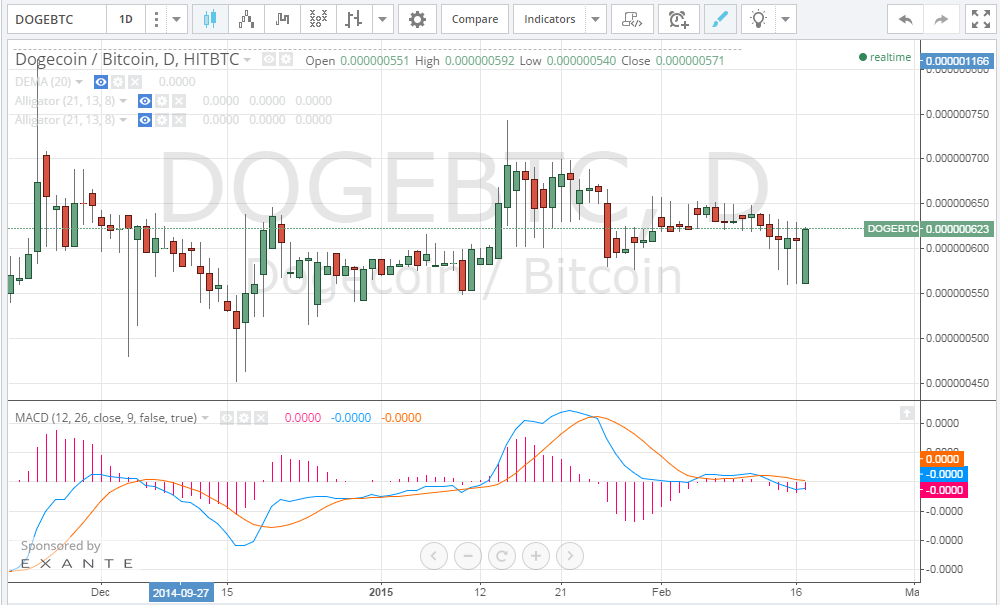
By studying the 1 day Hitbtc (DOGE/BTC) charts from tradingview.com and plotting the MACD indicator accordingly (look at the below chart), we can see how dogecoin price increased yesterday from 56 to 62 satoshis. If the current uptrend continues to push the price above the 50% Fibonacci retracement level (64.5 satoshis) as per our yesterday’s analysis, we can expect the price to rise to test the 62% Fibonacci retracement level (76.8 satoshis) within the next 48 hours.
The MACD indicator alignment is still not in favor of a strong bullish wave, despite the fact that the value of the MACD has just moved into the positive territory. An increase in the market’s buying power would force the MACD blue line to cross above the red signal line, before we can see a bullish wave pushing the price up towards the 77 satoshi resistance level.
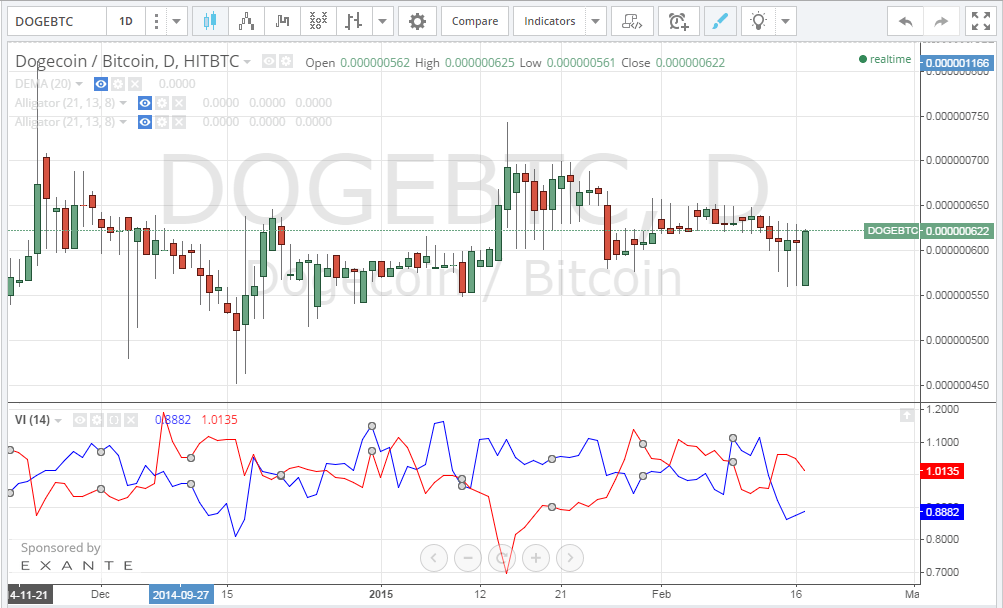
To better evaluate the market’s trend, we will plot the Vortex Indicator on the 1 day Hitbtc (DOGE/BTC) chart from tradingview.com. The red downtrend line of the Vortex Indicator has crossed above the blue uptrend line, which means that the market’s buying power still needs to build up strength before we can see Dogecoin price rise to higher levels.
Conclusion:
Dogecoin price rose to about 62 satoshis yesterday. Technical analysis signals an upcoming bullish wave that can push the price up to 65 satoshis within the next 24 hours.


Love these. I enjoy reading them because it helps me understand what is going on 🙂
Thanks for your daily technical analysis with charts, really helpful for us to know the tred for bitcoin