Reason to trust

How Our News is Made
Strict editorial policy that focuses on accuracy, relevance, and impartiality
Ad discliamer
Morbi pretium leo et nisl aliquam mollis. Quisque arcu lorem, ultricies quis pellentesque nec, ullamcorper eu odio.
Bitcoin has undergone a strong rally over the past 10 days, moving from $10,400 to a high near $11,750. As of this article’s writing, the coin trades for $11,400, far above those lows but still below those highs.
While some see this price action as consolidation before another thrust higher, Bitcoin has formed a strong bearish signal after this rally. Some fear that it is a precursor to a strong move to the downside, or at least one suggesting BTC will sink back towards the $10,000s.
Related Reading: Here’s Why Ethereum’s DeFi Market May Be Near A Bottom
Bitcoin Price Forms Pivotal Sell Signal
Bitcoin is forming some short-term sell signals despite it holding quite well in the face of news that OKEx has frozen withdrawals. The leading exchange did so on Friday morning, announcing that one of the private key holders of the company has not been in contact with the exchange.
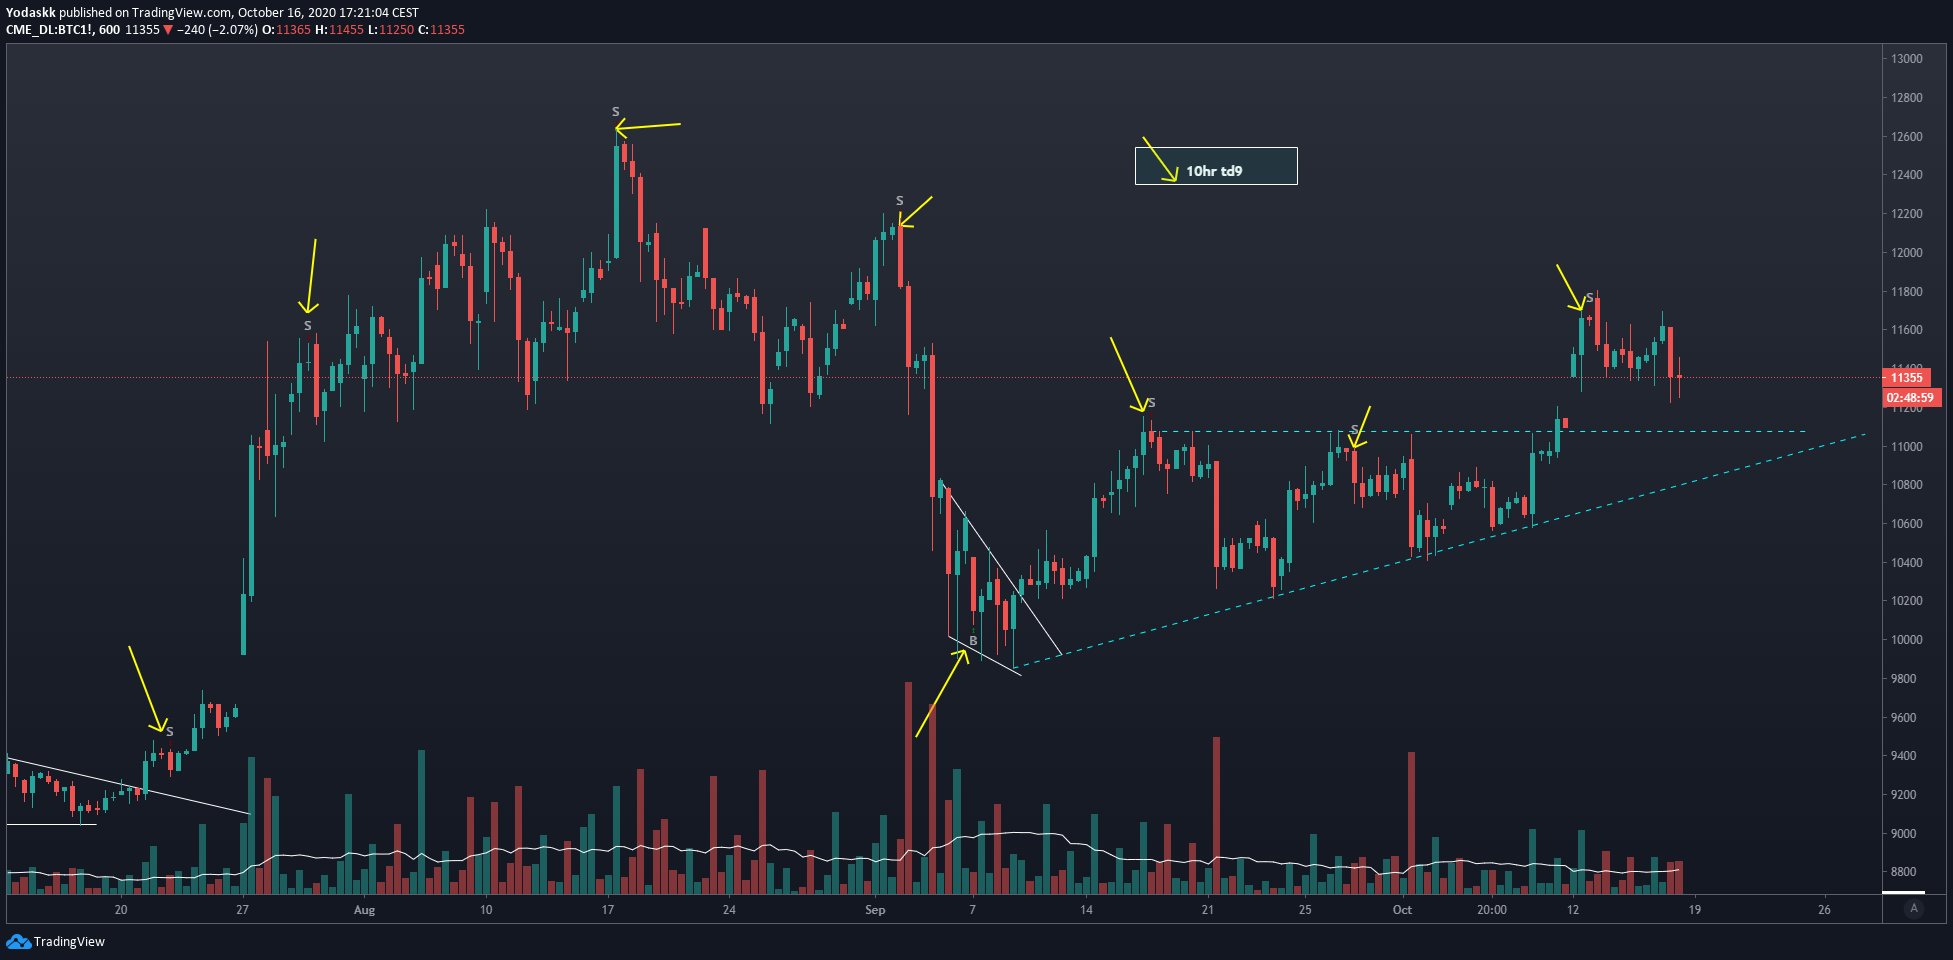
The cryptocurrency recently printed a Tom Demark Sequential “Sell 9” candle on its ten-hour CME futures chart, an analyst says.
This is important as this indicator has been extremely pivotal for Bitcoin over recent months. “Sell 9” candles have marked the $12,500 highs in August, the $12,000 local highs at the end of August preceding a $2,000 drop, along with short-term bottoms and tops. This latest signal suggests that ETH will continue its descent in the days ahead.
Chart of BTC's price action over recent months with a 10-hour CME futures chart analysis by crypto trader Coiner Yadox. Source: BTCUSD from TradingView.com
Related Reading: Tyler Winklevoss: A “Tsunami” of Capital Is Coming For Bitcoin
Not the Only Short-Term Bear
He isn’t the only bear. JP Morgan strategists noted that the cryptocurrency faces some headwinds as it begins to trade above its intrinsic value. The JP Morgan team has been covering crypto for years now.
The company added that there is seemingly an overhang of net long positions on crypto futures platforms, which may suggest that the market is overleveraged to the upside. This means that there is a potential that the market will move in favor of shorts to reset this positioning, thus avoiding overleveraging by long holders.
“The JPMorgan strategists said they calculated an intrinsic value by effectively treating Bitcoin as a commodity and looking at the marginal cost of production.”

Chart of BTC's price action since the start of 2017 with an instrinsic value analysis by JP Morgan analysts.
Related Reading: 3 Bitcoin On-Chain Trends Show a Macro Bull Market Is Brewing
Featured Image from Shutterstock
Price tags: xbtusd, btcusd, btcusdt
Charts from TradingView.com
Crucial Bitcoin Signal That Formed Prior to $2,000 Crash Returns


