Reason to trust

How Our News is Made
Strict editorial policy that focuses on accuracy, relevance, and impartiality
Ad discliamer
Morbi pretium leo et nisl aliquam mollis. Quisque arcu lorem, ultricies quis pellentesque nec, ullamcorper eu odio.
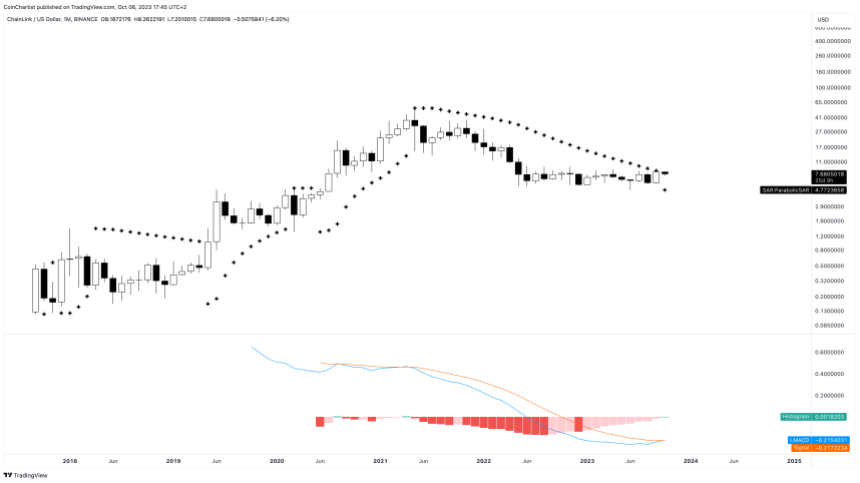
Chainlink (LINK) is trading at $7.60, still unable to escape the range between $5 and $8 it has spent over a year in. Its recent attempt at a rally, however, has triggered an important “parabolic”signal following a length, 28-month long downtrend.
Chainlink Taps Parabolic SAR After 28-Month Downtrend
Chainlink earned itself a reputation as a “blue chip” cryptocurrency during the last bear market. While Bitcoin, Ethereum, and other altcoins remained relatively bearish until the end of 2020, LINKUSD defied all odds and expectations by rising nearly 10,000% leading up to the same timeframe.
From October 2020 when the rest of the crypto market broke out, Chainlink still did another 600% before reaching a peak at over $50 in May 2021. But since then, it has been almost all downhill and a lot of sideways.
After that price peak, a rejection all the way down to $15 in the same month set the downtrend in motion. At that moment, it also tagged the Parabolic SAR, signaling that the uptrend had “stopped and reversed.”
The cryptocurrency first spent 12 months in an aggressive downtrend, followed by over 16 months of painful sideways. In total, the coin lost 90% of its value from top to the current local bottom. But what’s next now that the Parabolic SAR has been touched once again?

Chainlink tags the 1M Parabolic SAR | LINKUSD on TradingView.com
Is LINKUSD Ready For A 1,000% Rally? How About Three Of Them?
The Parabolic SAR is a technical analysis indicator created by J. Welles Wilder, Jr., and is used to tell a trader when a trend as potentially “stopped and reversed.” It is commonly used in conjunction with Wilder’s other tools, such as the Relative Strength Index, and Average Directional Index.
Much like the tool nailed the exact trend change at the top, it might once again be accurately signally a positive trend change after 28 months of downward Parabolic SAR movement. Previous uptrend according to the 1M LINKUSD Parabolic SAR were parabolic indeed.
Across the three times where the Parabolic SAR flipped bullish, LINKUSD gained 1,000% each time. Another 1,000% rally would take Chainlink to over $80 per token. The last primary bull market in Chainlink produced not one, but three of these 1,000% rallies. A 3,000 uptrend could take the coin to over $230 each.
Coincidentally, the LMACD is also crossing bullish for the first time in 28 months, adding plenty of confluence. With the Parabolic SAR now below price, will the cryptocurrency go on another parabolic uptrend?
This chart initially appeared in Issue #22 of CoinChartist (VIP) alongside 30 other exclusive crypto charts. Subscribe for free.


