Reason to trust
How Our News is Made
Strict editorial policy that focuses on accuracy, relevance, and impartiality
Ad discliamer
Morbi pretium leo et nisl aliquam mollis. Quisque arcu lorem, ultricies quis pellentesque nec, ullamcorper eu odio.
Chainlink (LINK) started a fresh decline after it failed near a major hurdle at $11.00 against the US Dollar. It is down 10% and it could accelerate lower below $8.00.
- Chainlink token price topped near a major resistance at $11.00 against the US dollar.
- The price is now trading well below the $10.00 pivot level and the 100 simple moving average (4-hours).
- There is a crucial bearish trend line forming with resistance near $9.50 on the 4-hours chart of the LINK/USD pair (data source from Kraken).
- The pair could continue to move down below $8.50 as long as it is below $10.00.
Chainlink (LINK) Price is Showing Bearish Signs
In one the previous technical analyses, we discussed the chances of a strong rejection in chainlink (LINK) near the $11.00 resistance zone. The previous support zone acted as a strong barrier and the price dived from the $11.25 swing high.
There was a steady decline and a rejection pattern below the $10.00 level. The price even broke the $9.50 support level and settled well below the 100 simple moving average (4-hours).
The decline gained pace below the 50% Fib retracement level of the upward move from the $7.26 low to $11.25 swing high. More importantly, there is a crucial bearish trend line forming with resistance near $9.50 on the 4-hours chart of the LINK/USD pair.
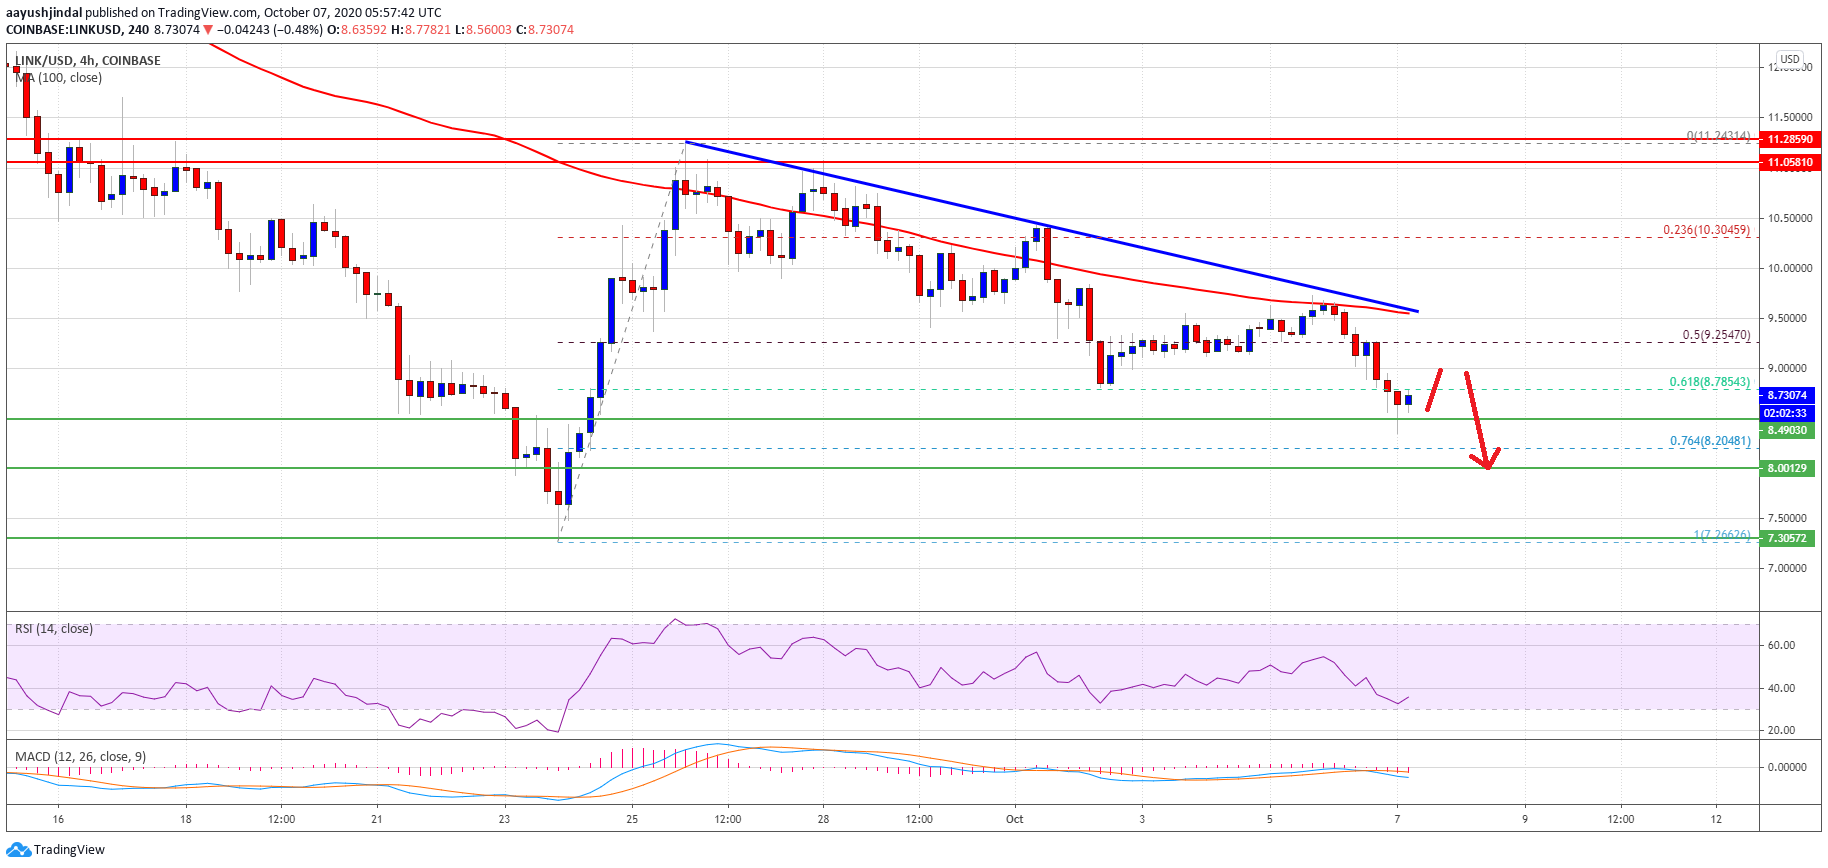
LINK price trades below $9.50. Source: TradingView.com
The price is now trading near the key $8.50 support level. The next major support is near the $8.20 level since it is close to the 76.4% Fib retracement level of the upward move from the $7.26 low to $11.25 swing high.
The next major support is near the $8.00 level, below which the price is likely to gain bearish momentum below the $7.80 level. Any further losses could lead the price towards the $7.25 support.
Upsides Capped?
If chainlink’s price starts an upside correction from the $8.50 support, it is likely to face many hurdles. An initial resistance is near the $9.00 level.
The first major resistance is near the $9.20 level. The main resistance is near the trend line and the 100 simple moving average (4-hours), above which the bulls could attempt an upside break above $10.00.
Technical Indicators
4-hours MACD – The MACD for LINK/USD is now gaining pace in the bearish zone.
4-hours RSI (Relative Strength Index) – The RSI for LINK/USD is now well below the 40 level.
Major Support Levels – $8.50, $8.20 and $8.00.
Major Resistance Levels – $9.00, $9.20 and $9.50.