Reason to trust

How Our News is Made
Strict editorial policy that focuses on accuracy, relevance, and impartiality
Ad discliamer
Morbi pretium leo et nisl aliquam mollis. Quisque arcu lorem, ultricies quis pellentesque nec, ullamcorper eu odio.
On-chain data shows the Cardano whales have just had their most active week in nine months. Here’s what it may mean for the asset’s price.
Cardano Whale Transaction Count Has Been Elevated Recently
As per data from the on-chain analytics firm Santiment, the last time similar whale activity was observed was back in May 2022. The relevant indicator here is the “whale transaction count,” which tells us the total number of Cardano transfers taking place on the network that involved a movement of ADA worth at least $100,000 in value.
When the value of this metric is high, it means whales are making a large number of transactions on the blockchain currently. Such a trend suggests these humongous holders have an active interest in trading the cryptocurrency right now.
Generally, activity from the whales can be something to watch for, as the sheer scale of this cohort’s movements can carry the power to cause visible shifts in the market. Therefore, whenever the whale transaction count has high values, the price of the asset may feel some high volatility.
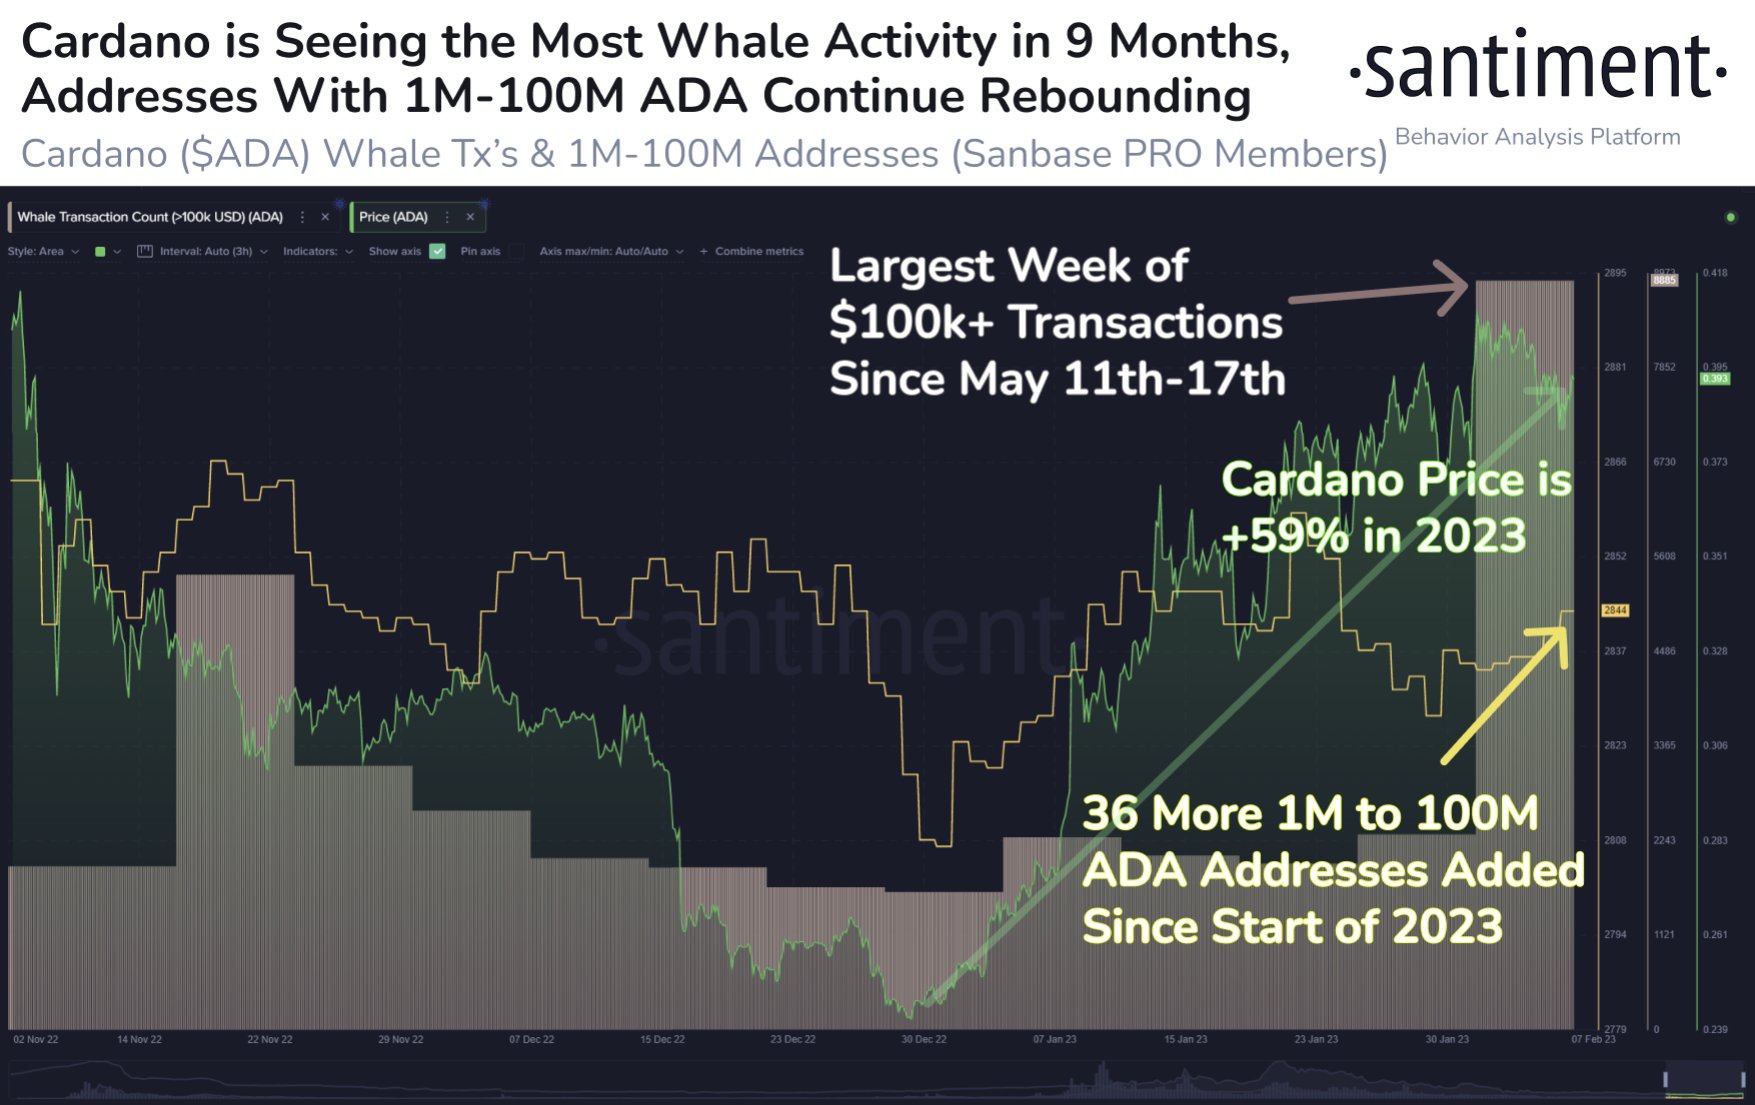
Now, here is a chart that shows the trend in this Cardano indicator over the last few months:
Looks like the value of the metric has been pretty high in recent days | Source: Santiment on Twitter
As displayed in the above graph, the Cardano whale transaction count has been at very high values during the past week. In fact, the past week was the most active for this cohort since nine months ago, back between the 11th and 17th of May 2022.
Interestingly, in that previous instance, the ADA price observed a 36% rally between the start of the week of high whale activity and the local top in early June (which was the next month).
It’s possible that the current week of high whale transactions may result in the value of Cardano feeling a similar constructive effect. However, it’s far from a certainty.
The reason behind that is the indicator doesn’t distinguish between selling and buying transactions, so the current high activity could very well be dominated by distribution from the whales, which might provide a bearish effect on the price.
In the chart, Santiment has also shown data of the “ADA Supply Distribution” metric for the addresses holding between 1 million and 100 million ADA. The Supply Distribution measures the total number of addresses that are currently holding a number of coins falling inside a range (which, in the current case, is 1 million to 100 million ADA).
It seems like overall, 36 new addresses have popped up in this range since the start of the year, which could suggest that there has been some accumulation going on in the market recently.
Earlier during the rally, the metric’s value saw a plunge, but in the last few days, there has been some fresh rise, hinting that at least some of the current high Cardano whale activity could indeed be for accumulation purposes.
ADA Price
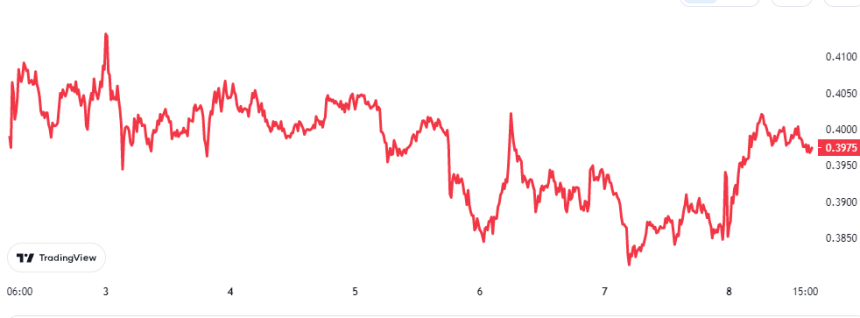
At the time of writing, Cardano is trading around $0.3975, up 4% in the last week.

ADA seems to have been trading sideways recently | Source: ADAUSD on TradingView


