

Dubbed as the “internet of blockchains,” Polkadot (DOT) has seen a price reduction recently, falling below the crucial $6 barrier. This decline has had an impact on the investing community, raising concerns about whether it represents a temporary anomaly or the beginning of a sustained downward trend. While analysts meticulously examine charts and technical indications, discussions regarding DOT‘s future course continue.
Bullish Signals Amidst Short-Term Woes
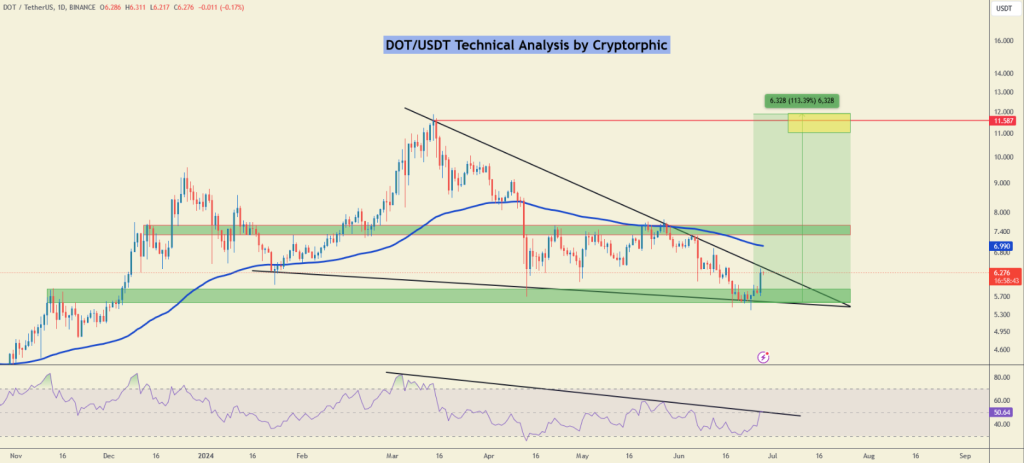
For those who depend on technical analysis, Polkadot’s recent losses notwithstanding still hope.There now shows on the DOT/USDT chart a declining triangle pattern. Usually indicating a range of support between $5.5 and $6.0, this pattern Historically, this area has been a barrier, so preventing notable price cuts.
#DOTUSDT is currently trading within a well-defined descending triangle pattern with strong support around the $5.5-$6 range.
~ Support Zone: A strong support zone exists between $5.5 and $6, highlighted in green. This area has historically acted as a significant support level,… pic.twitter.com/jUSXMqJ9FW
— Cryptorphic (@Cryptorphic1) June 28, 2024
For Polkadot to see a substantial increase in price, it must surpass the notable resistance levels of $7.5 and $11.55, with the latter representing the greatest price achieved earlier this year. If the bulls are able to surpass these resistance levels, they have the potential to initiate a focused rally towards the $12 mark. Nevertheless, if the price falls below the crucial support level of $5.5, it might negate the current optimistic perspective and indicate a prolonged period of decline.

Long-Term Vision For Polkadot
For many investors, Polkadot’s long-term value proposition is still a ray of sunshine in the dark market. An important issue in the blockchain industry, Polkadot intends to solve the problem of interoperability.
When the RSI produces lower lows when the price is falling, it is known as bullish divergence. In this case, the RSI is displaying this phenomenon. I find this to be an interesting point to note. This gap suggests that there may be more purchasing pressure, which might lead to a price reversal.

A 226% increase from its current level, Polkadot’s value is projected to reach $19.67 by July 30, 2024, according to recent forecasts. This forecast aligns with a level-headed and impartial market mindset, as indicated by a Fear & Greed Index score of 47. The price of Polkadot has changed 8.07 percent and has 47 percent positive days in the last 30 days.
However, investors should take the market dynamics as a whole into account, not only the short-term price changes. Factors like as regulatory oversight, the availability of alternative interoperability solutions, and macroeconomic trends might impact Polkadot’s price point. If you want to know more about the state of the project and its future possibilities, you should look at Polkadot’s core features and development history.
The intrinsic volatility of the market necessitates meticulous planning and analysis when investing in Polkadot and other cryptocurrencies. The market’s evolution, which is indicative of broader trends and movements in the blockchain sector, will undoubtedly make Polkadot’s voyage a fascinating one to observe.
Featured image from Deseret News, chart from TradingView