Reason to trust

How Our News is Made
Strict editorial policy that focuses on accuracy, relevance, and impartiality
Ad discliamer
Morbi pretium leo et nisl aliquam mollis. Quisque arcu lorem, ultricies quis pellentesque nec, ullamcorper eu odio.
- BNB has been maintaining a bullish move for the past few weeks, but the price is now retracing near $20.5 support level.
- Binance Coin remains bullish on the hourly chart, but the bears may take over if the price drops below the ascending broadening wedge.
Over the past few weeks, Binance Coin has witnessed substantial growth which has led the cryptocurrency to surge above $20 following a recent price break.
The performance of BNB has created a bullish sentiment, which is positioning the market for an incoming bull run. Meanwhile, the 7th largest cryptocurrency is currently retracing for the next bullish swing.
Binance Coin Price Analysis
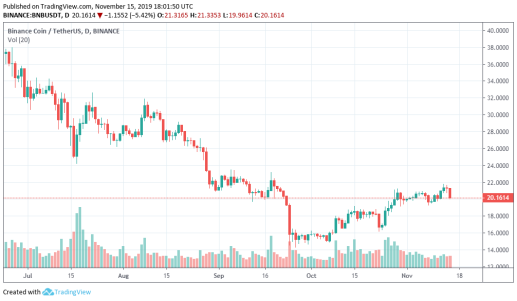
Looking at the hourly chart, Binance Coin is trading above $20 – a price level that was broken a few days ago. At the moment, BNB is under bearish pressure, although buying pressure is expected to continue in the next couple of hours. Going back to late September low on the daily chart, we can see that the BNB trend has completely reversed.
More so, the recent price break was another indicator of a mid-term bullish trend. Adding to the bullish scenario, the price of Binance‘s BNB is now looking positive on the daily technical indicators.
Over the past two days now, the price is trading under $21 due to the short-term corrective pullback. If the bulls can regroup well, Binance Coin could reach $21.6, $23 and $24.
Otherwise, the bears may step back in the market, which might lead to serious price drops. In that case, the BNB/USD pair could fall from the wedge boundary to $20.5, $20, and $19. However, the price action is still shaping well in the wedge for now.
A cryptocurrency trader stated that “moon” is likely the target once BNB surges above the current range.
and there she goes.
looks like CZ just activated moon.exe pic.twitter.com/yPLmxgdyUT
— Bluntz (@Bluntz_Capital) November 13, 2019
Are Bulls Back in the Game?
Binance Coin has started to see bullish momentum and although it is likely to see a pullback in the short term, its long term outlook remains promising.
However, if the market slumps below the wedge, the price of BNB may drop as low as $19 before starting the bullish trend. Although, Bullish trend continuation is expected once the market finds support on the wedge’s lower boundary.

Technical Indicator Reading
Hourly MACD – the MACD for Binance Coin has crossed to the negative due to the last two days of bearish actions.
Hourly RSI – The RSI for BNB is now well below 50 to show that the bears are gaining control of the market.
Key resistance levels: $21.6, $23, $24
Key support levels: $20.5, $20, $19


