Reason to trust

How Our News is Made
Strict editorial policy that focuses on accuracy, relevance, and impartiality
Ad discliamer
Morbi pretium leo et nisl aliquam mollis. Quisque arcu lorem, ultricies quis pellentesque nec, ullamcorper eu odio.
Data shows large transactions are rising in dominance as whales are moving their coins. This hints at Bitcoin’s increased maturation as a macro asset.
Large Transactions Are On The Rise On The Bitcoin Network
According to the latest weekly report from Glassnode, large transactions are becoming increasingly dominant on the BTC network, hinting that whales and institutional investors are showing rising interest in the crypto.
The relevant indicator here is the total transfer volume breakdown by size (7-day moving average). This metric classifies the total transactions happening on the network into specific ranges based on the size of the transfer.
Here is a chart showing the trend in the Bitcoin volume based on the various transaction sizes:

Large transactions are growing dominant in the BTC market | Source: Glassnode
The above graph shows that trading volume has again surged back recently after plunging down during the month of June and staying low ever since. Such high volumes show that there is a lot of interest going on in the coin right now.
There is a box on the chart that covers the volumes between $13.6 billion and $16.8 billion. This box highlights the two regions of most volume where values were close to the all-time-high (ATH).
Related Reading | Bitcoin S2F Creator PlanB Thinks BTC Will Reach $135k By December
The difference between both the peaks becomes apparent on a closer examination of the chart. It looks like transactions of size higher than $10 million have become increasingly dominant recently, when it wasn’t the case during the bull run in the first half of the year.
Such large transactions belong to whales, institutional investors, trading desks, and other high worth entities. A rise in these entities shifting around their coins suggests that Bitcoin has become more mature as a macro asset.
BTC Price
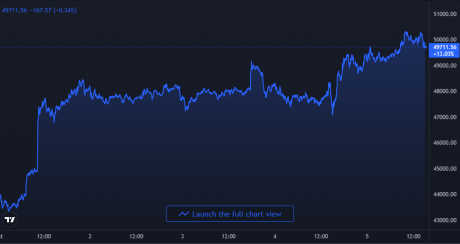
At the time of writing, Bitcoin’s price floats around $49.9k, up 20% in the last seven days. Over the last thirty days, the crypto has lost 0.6% in value.
Related Reading | Bitcoin Shakes Off Bloody September As Price Breaks $50K, Headed For New All-Time Highs?
The below chart shows the trend in the price of the coin over the last five days:

Bitcoin's price shows some uptrend after moving sideways for the past few days | Source: BTCUSD on TradingView
Over the last few days, BTC mostly moved sideways after a very sharp move up. This changed yesterday when the coin finally showed some movement up and today the coin retested $50k.
Right now, the coin has rebounded back down a little, but Bitcoin will probably continue to test the level in the next few days. It’s unclear if BTC will break through the level anytime soon, or if it will correct lower in the short term.
Featured image from Unsplash.com, charts from TradingView.com, Glassnode.com


