Reason to trust

How Our News is Made
Strict editorial policy that focuses on accuracy, relevance, and impartiality
Ad discliamer
Morbi pretium leo et nisl aliquam mollis. Quisque arcu lorem, ultricies quis pellentesque nec, ullamcorper eu odio.
Bitcoin has bounced over 10% from the lows set two weeks ago at around $9,800. The cryptocurrency, though, still has a crucial level to move above to confirm that a full-blown bullish reversal is in the works.
Related Reading: Ethereum Transaction Fees Surge to All-Time Highs After Uniswap Launch
Bitcoin Needs to Surmount This Pivotal Level to Confirm Upside
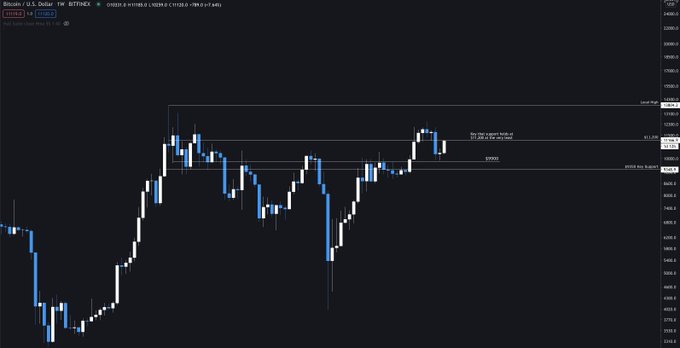
According to Edward “Teddy” Cleps, a crypto analyst and the founder of Yellow Block, Bitcoin must move above the $11,100 horizontal to confirm that the ongoing correction is a bullish reversal.
Cleps shared the chart below on September 20th, accentuating the importance of $11,100 to Bitcoin over recent weeks. As the chart indicates, Bitcoin bounced multiple times at the $11,000 support during last month’s consolidation between $11,000-12,000. BTC managing to confirm that level as support will likely trigger a move towards $12,000.
Cleps explained more about the signifiance of that level when he wrote:
“Trend is bullish as long as it is above the purple box – this dump could be seen as a ‘higher low’. However, lambo season is above that line – let’s break it please.”
Chart of BTC's price action over the past few months with analysis by crypto trader Edward "Teddy" Cleps (@Teddycleps on Twitter). Chart from TradingView.com
Related Reading: Critical On-Chain Signal Predicts That Bitcoin’s Next Move Will Be Upward
Other analysts have confirmed the importance of the resistances in $11,000-11,200 to Bitcoin’s medium-term bull case.
Another market commentator, referencing the chart seen below, said the following on the importance of that zone:
“Target / Major resistance finally hit, if you worried about price dropping from here and using leverage then close out your position and wait for this level to be flipped support… $11,200 is a key HTF level for flipping it will not be easy.”
Chart of BTC's price action over the past two years with analysis by crypto trader Cactus (@TheCryptoCactus on Twitter). Chart from TradingView.com
Long-Term Trend Still Bullish: Willy Woo
Bitcoin’s long-term remains in a positive state despite any weakness in the near term, on-chain analysts say.
Willy Woo recently commented that Bitcoin’s macro Difficulty Ribbon metric is currently in a period of compression, which is a “reliable indicator of bullishness.”
Zooming out to the mid macro (months ahead), we’re in a really nice zone of Difficulty Ribbon compression, post halvening (red verticals), this is quite a reliable indicator of bullishness.
He added that there are other trends like a spike in on-chain BTC moved that suggests long-term upside is likely.
Related Reading: MicroStrategy’s Stock Continues to Soar After Bitcoin Purchase
Featured Image from Shutterstock
Price tags: xbtusd, btcusd, btcusdt
Charts from TradingView.com
Despite 10% Bounce From Lows, Bitcoin Has One Key Level to Cross


