Reason to trust

How Our News is Made
Strict editorial policy that focuses on accuracy, relevance, and impartiality
Ad discliamer
Morbi pretium leo et nisl aliquam mollis. Quisque arcu lorem, ultricies quis pellentesque nec, ullamcorper eu odio.
Fear and greed are just two key emotions that drive the price action behind all markets, including Bitcoin and other cryptocurrencies.
A bizarre correlation has been discovered in on-chain Bitcoin network data that directly matches up with the cryptocurrency market “fear and greed” index. Here’s why this find is so striking and and what information investors, traders, and analysts can glean from the data.
Bitcoin Behaviors: Fear And Greed Appears In Unspent Transaction Outputs
There’s nothing else quite like Bitcoin and the way the network and user base behaves. As a result, certain tools have been developed to analyze the cryptocurrency network’s on-chain metrics, including the total number of transactions, how much money is being spent, and much more.
The data also includes very specific and specialized information such as unspent transaction output (UTXO).
Related Reading | Why March Is The Bloodiest Month In Bitcoin History
As a speculative asset, nothing else quite behaves like Bitcoin. Shifts in sentiment take price action to the extreme. As a result, tools have been developed to monitor the fear or greed in the market.
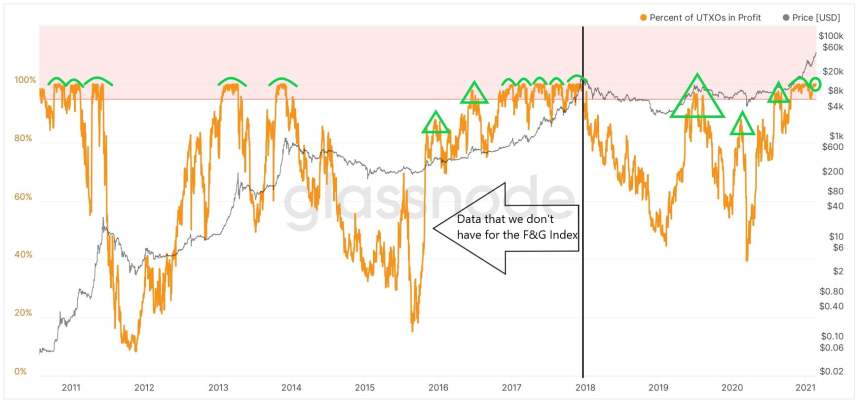
Interestingly, one crypto analyst has discovered that the percentage of UTXOs in profit matches the fear and greed index perfectly.
So we've all been wondering how the Fear & Greed index looks in bull markets since the data only goes back to 2018. I figured it out today. This is the F&G index compared with the data on % of BTC UTXOs in profit provided by @glassnode: pic.twitter.com/TF0ywd4Ble
— Stillman (@Stillm4n) February 22, 2021
Each peak and trough in the fear and greed index aligns eerily well with UTXO data layered over the Bitcoin price chart. And because the data matches so accurately, it can potentially be incredibly useful for timing tops during the current bull market.
UTXOs Provide Clues To Bull Profits Of Past Crypto Cycles
The fear and greed index was launched in 2018, right as the bear market began. The index was born in the bear market, and only a handful of times has reached the point of true greed.
When Bitcoin reached greed in 2019, a sharp reversal to retest the bottom took place. Since then, Bitcoin has creeped increasingly higher on the fear and greed index.
Related Reading | Forget 2021, Here’s How High Bitcoin Price Can Go By 2026
Using the UTXO data that matches the fear and greed index so well after the tool was launched, there’s an opportunity to potentially understand how fear and greed played out in the previous bull markets.
In 2013, there were two major greed-fueled impulses, followed by a bear market. In 2017, the bull market ran freely for nearly a full year – leaving bump after bump on the chart.

Here's what past bull market greed-driven "peaks" look like. | Source: Glassnode
A total of five large bumps appear in 2017 following two triangle peaks. During this cycle, there’s a third triangle-shaped peak, but only one bump so far. Does this mean that Bitcoin could have as many as four more bullish impulses left before the top is in?
Anything is possible, but if the fear and greed index begins to turn down in the days and weeks ahead, could be a sign that a new bear market has begun.
Featured image from Deposit Photos, Charts from TradingView.com


