We are off on another day’s trading in the bitcoin price and what a twenty-four-hour period we are having. Things just don’t want to slow down right now and – while that’s a great thing from the perspective of our intraday breakout approach – it does have us on alert for a potential correction near term.
So long as we stay vigilant on the risk management side of things, any correction isn’t too much of a big deal – we’ll still be able to jump in and out on any volatility, whatever direction price moves.
So, with that all said, let’s kick things off for the session.
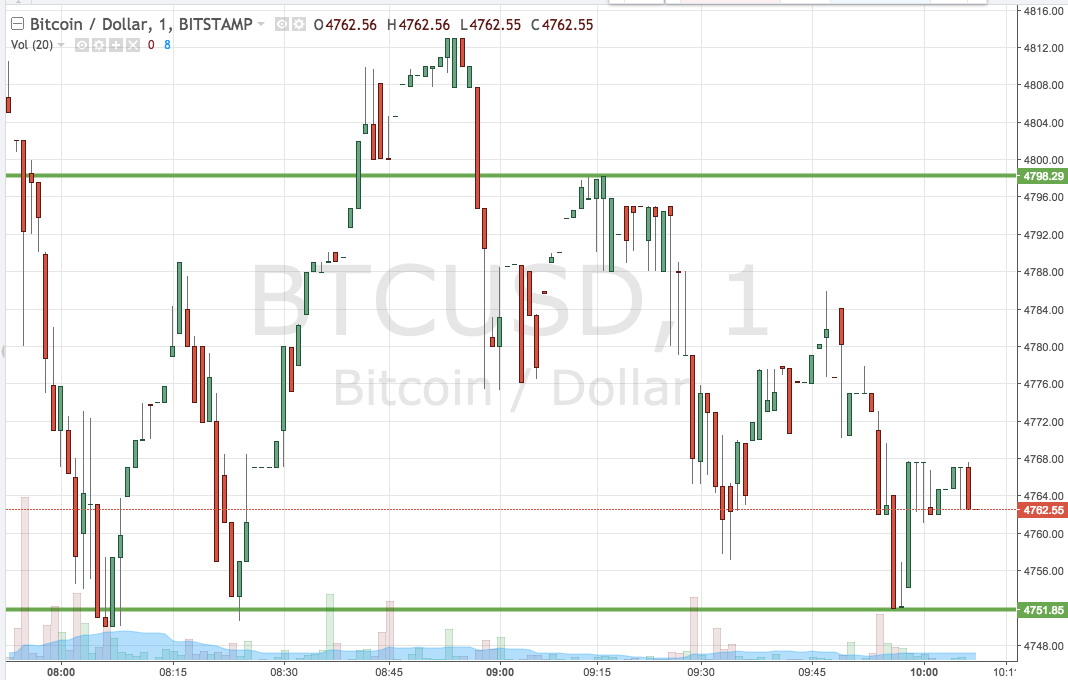
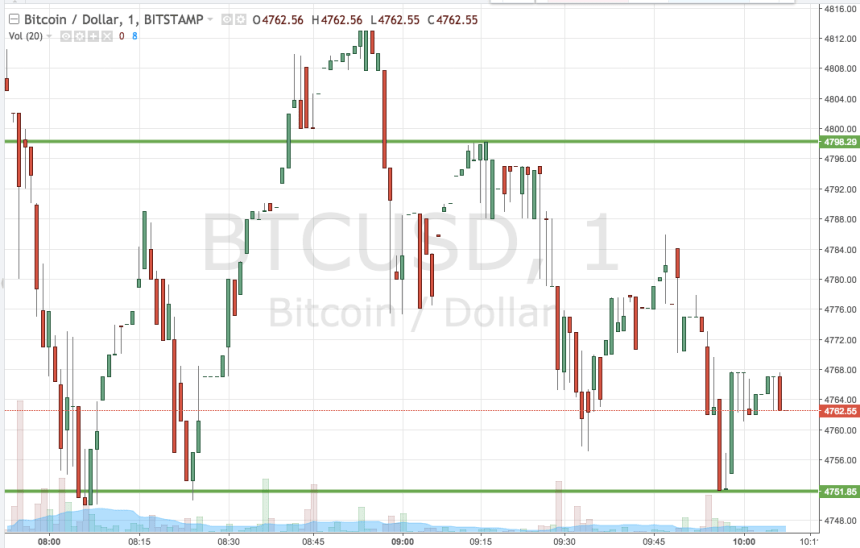
We’re going to outline some key levels as a starting point and then we’ll take a look at how we can use these levels to navigate the markets throughout the session. As ever, take a quick look at the chart below before we get started so as to get an idea where things stand and where we are looking to execute on our entries. It’s a one-minute candlestick chart and it’s got our key range overlaid in green.

So, as the chart shows, the range we have in our sights for the session today comes in as defined by support to the downside at 4751 and resistance to the upside at 4798. Just as was the case yesterday evening, we are going to stick primarily to our breakout strategy for the early session.
There are two trades on, with our entries as follows:
- A close above resistance and we’ll jump into the markets long towards an upside target of 4840. A stop on the trade at 4785 will ensure we are taken out of the trade in the event of a bias reversal.
- Conversely, a close below support will signal a downside entry towards 4710. A stop on this one at 4762 looks good.
Let’s see how things play out.
Charts courtesy of Trading View


