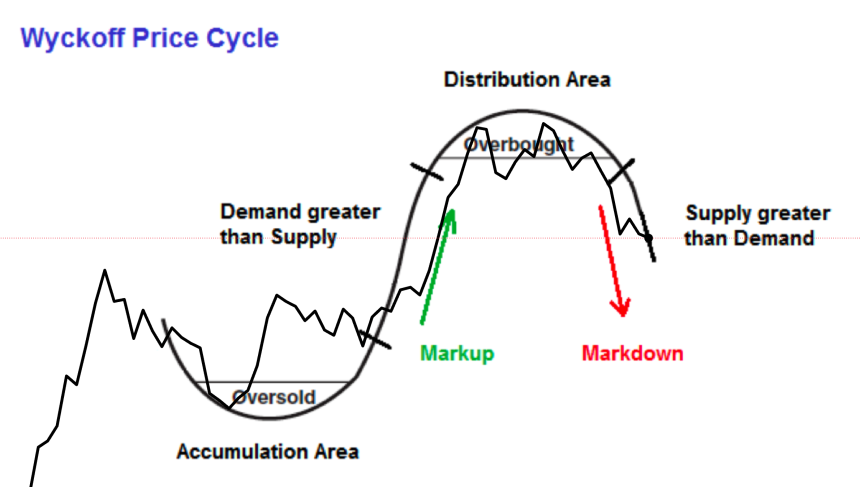
In this episode of NewsBTC’s daily technical analysis videos, we compare Bitcoin price action with Wyckoff accumulation schematics, price cycles and more.
Take a look at the video below:
VIDEO: Bitcoin Price Analysis (BTCUSD): September 8, 2022
This video provides a detailed look at Bitcoin market cycles using Wyckoff theory and other cyclical tools.
Is The Composite Man Behind Bitcoin Mark Down?
Wyckoff theory is based on the idea that retail traders are regularly outsmarted by large operators he referred to as the Composite Man. It is also known for its phases of accumulation and distribution, and the mark up and mark down phases that occur in between as the market goes through bullish and bearish cycles.
The recent price action continues to follow what looks a lot like Wyckoff accumulation. After breaching preliminary support, price reached the selling climax at $17,500. What we potentially just saw this week was a secondary test in phase B. that’s the good news. The bad news is that there could be a long time until we see high prices again.
A comparison with an Wyckoff accumulation schematic | Source: BTCUSD on TradingView.com
How A Spring Could Put An End To Crypto Winter
That was also just one of Wyckoff’s accumulation schematics. Another schematic example includes a final shakeout called a spring. Based on the schematic, the spring would occur some time around December and a breakout would occur in April.
This is especially notable, because that is exactly when Bitcoin bottomed in 2018 and when the accumulation phases ended in 2019. Even more interesting, is the fact that December has frequently been a timing factor for tops and bottoms in Bitcoin all throughout its history.
Will we get a spring or not? | Source: BTCUSD on TradingView.com
Related Reading: WATCH: Ethereum Gains Momentum Ahead Of The Merge | ETHUSD September 6, 2022
Wyckoff, Gann, And Other Technical Analysis Greats
Even the 2017 peak was in December, which we are currently retesting for the umpteenth time. The month of December mysteriously was one of WD Gann’s favorite months to look for tops and bottoms, and it was due to how the Sun conjuncts Mercury while in Sagittarius.
Gann, like Wykoff was one of the all-time greats. Both are known as two of the five titans of finance, which include with Charles Merrill from Merrill Lynch, Charles Dow from Dow Theory and the Dow Jones Industrial Average, and Ralph Nelson Elliott who created Elliott Wave Theory.
Gann’s methodology was the most mystical of them all. Check out how flawlessly one of his tools, the Gann fan, called the breakout from the bear market and an incredible 500% advance in the example below.
Gann's tools are based on geometry, angles, and time | Source: BTCUSD on TradingView.com
What To Make Of The Current BTCUSD Market Cycle
Markets are indeed cyclical, as Wyckoff and the other greats believed. The cycle begins with accumulation after an asset becomes oversold. Demand begins to outweigh supply and mark up begins. Then the composite man begins to slowly distribute on retail, before mark down begins and supply outweighs demand.
It sounds simple, but this is just how it works. Bases on a visual inspection alone and how history has rhymed in the past, we could potentially be in or nearing accumulation and mark up will return soon enough.
Is it almost time for another bull run? | Source: BTCUSD on TradingView.com
Learn crypto technical analysis yourself with the NewsBTC Trading Course. Click here to access the free educational program.
Follow @TonySpilotroBTC on Twitter or join the TonyTradesBTC Telegram for exclusive daily market insights and technical analysis education. Please note: Content is educational and should not be considered investment advice.
Featured image from iStockPhoto, Charts from TradingView.com
