Reason to trust
How Our News is Made
Strict editorial policy that focuses on accuracy, relevance, and impartiality
Ad discliamer
Morbi pretium leo et nisl aliquam mollis. Quisque arcu lorem, ultricies quis pellentesque nec, ullamcorper eu odio.
- Ripple price remained in broad range and recently tested the $0.4070 level against the US dollar.
- The price is currently trading above the $0.4000 support, but it is facing many hurdles on the upside.
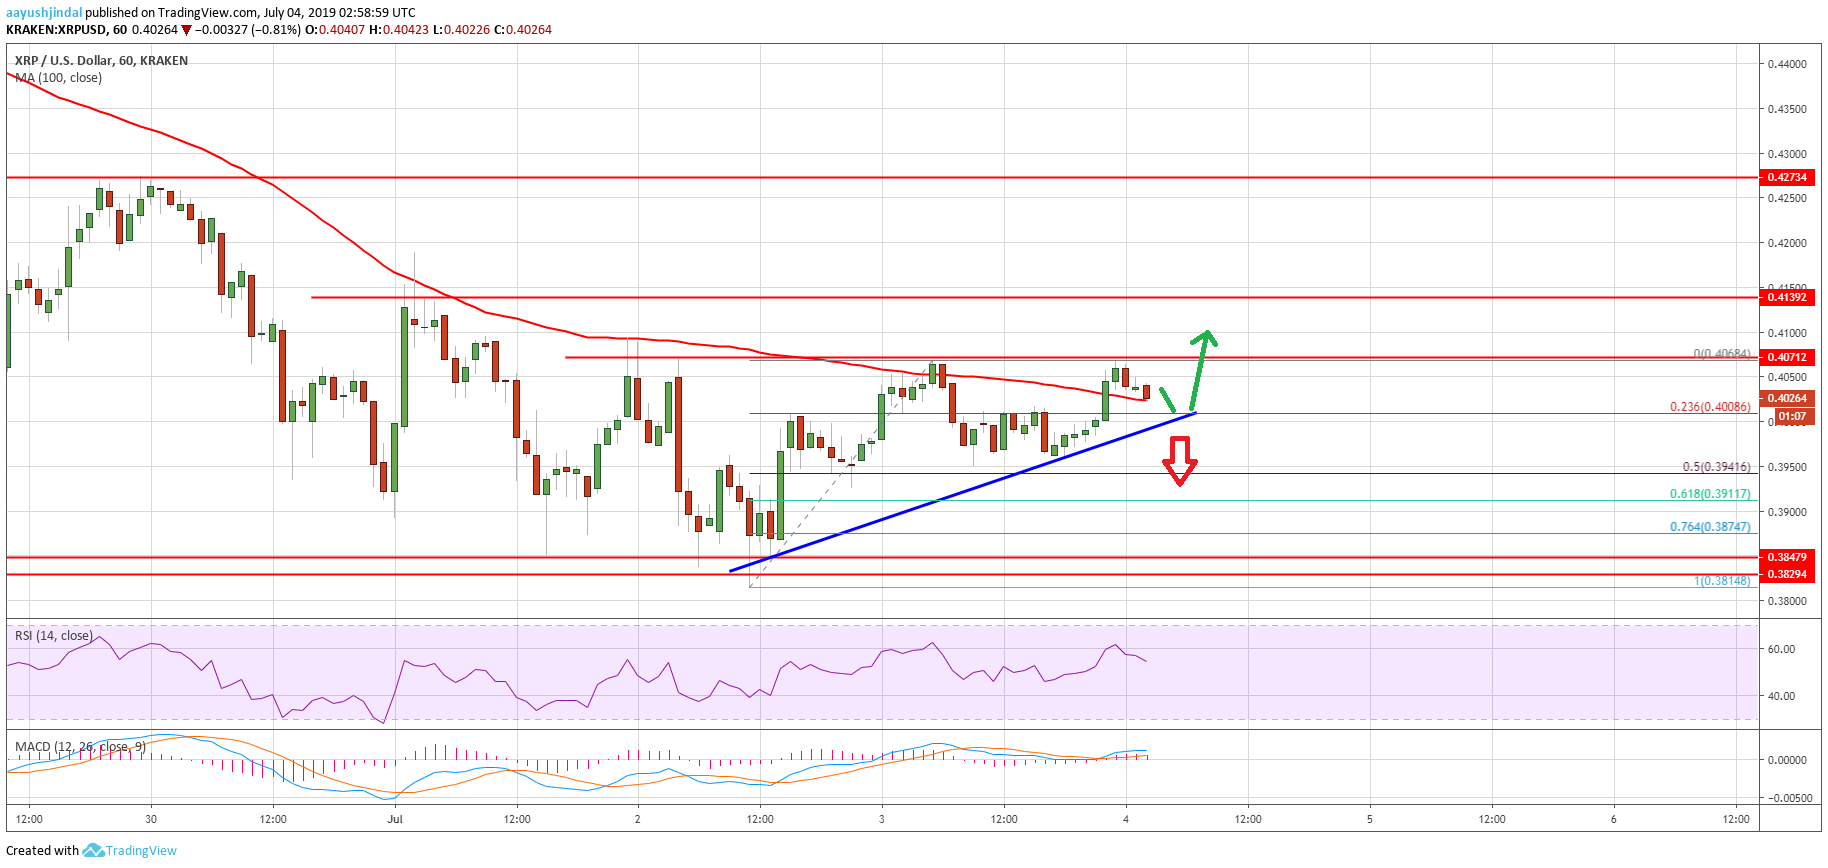
- There is a connecting bullish trend line forming with support at $0.4008 on the hourly chart of the XRP/USD pair (data source from Kraken).
- The price could either break $0.4075 and climb higher or decline again below $0.4000.
Ripple price is still consolidating in a broad range against the US Dollar, while bitcoin climbed towards $12,000. XRP price must break $0.4075 and $0.4140 to continue higher.
Ripple Price Analysis
In the past few sessions, there was strong rise in bitcoin price above $11,500, but ripple price remained in a range against the US Dollar. The XRP/USD pair started a slow and steady rise from the $0.3814 swing low. It broke the $0.3920 and $0.4000 resistance levels. There was also a break above the $0.4050 level and the 100 hourly simple moving average. However, the price struggled to clear the $0.4070 resistance.
It corrected lower below $0.4050 plus the 23.6% Fib retracement level of the upward move from the $0.3814 low to $0.4068 high. However, the $0.3960 level acted as a support and the price climbed back above the 100 hourly SMA. Moreover, it stayed above the 50% Fib retracement level of the upward move from the $0.3814 low to $0.4068 high.
There is also a connecting bullish trend line forming with support at $0.4008 on the hourly chart of the XRP/USD pair. If there is a downside break below the trend line and the 100 hourly SMA, ripple price could accelerate losses below $0.3950. The next major support is near the $0.3850 level, below which there is a risk of more losses towards the $0.3750 level.
On the upside, an immediate resistance is near the $0.4070 level. If there is an upside break above $0.4070, the price could rise towards the next major resistance near $0.4140. Any further gains is likely to push the price towards the $0.4200 and $0.4220 resistance levels.
Looking at the chart, ripple price is clearly trading in a broad range and seems to be preparing for the next break either above $0.4070 or below $0.4000. If it fails to continue higher, there are chances of sharp declines below $0.3950 and $0.3900. Conversely, a close above $0.4100 might improve the market sentiment.
Technical Indicators
Hourly MACD – The MACD for XRP/USD is slowly gaining pace in the bullish zone.
Hourly RSI (Relative Strength Index) – The RSI for XRP/USD is currently correcting lower towards the 50 level.
Major Support Levels – $0.4000, $0.3920 and $0.3850.
Major Resistance Levels – $0.4070, $0.4140 and $0.4200.