Reason to trust
How Our News is Made
Strict editorial policy that focuses on accuracy, relevance, and impartiality
Ad discliamer
Morbi pretium leo et nisl aliquam mollis. Quisque arcu lorem, ultricies quis pellentesque nec, ullamcorper eu odio.
Bitcoin price is showing bearish signs below $35,800 and $36,000 against the US Dollar. BTC is likely to continue lower below the $34,000 and $33,000 support levels in the near term.
- Bitcoin is trading in a bearish zone below the $35,800 and $36,000 resistance levels.
- The price is gaining bearish momentum below $35,500 and the 100 hourly simple moving average.
- There is a key rising channel forming with support near $34,550 on the hourly chart of the BTC/USD pair (data feed from Kraken).
- The pair could accelerate losses once it breaks the $34,500 and $34,000 support levels.
Bitcoin Price Turns Short-Term Bearish
Yesterday, we discussed the chances of a break towards $33,000 in bitcoin price. BTC did follow a bearish path below the $35,000 support and it broke the $34,000 support level.
It traded as low as $33,396 and settled well below the 100 hourly simple moving average. Recently, there was an upside correction above the $34,000 level. The price climbed above the 23.6% Fib retracement level of the key decline from the $37,837 high to $33,396 low.
Bitcoin price even climbed above the $35,000, but it struggled to clear the $35,800 resistance. It seems like the price failed to clear the 50% Fib retracement level of the key decline from the $37,837 high to $33,396 low.
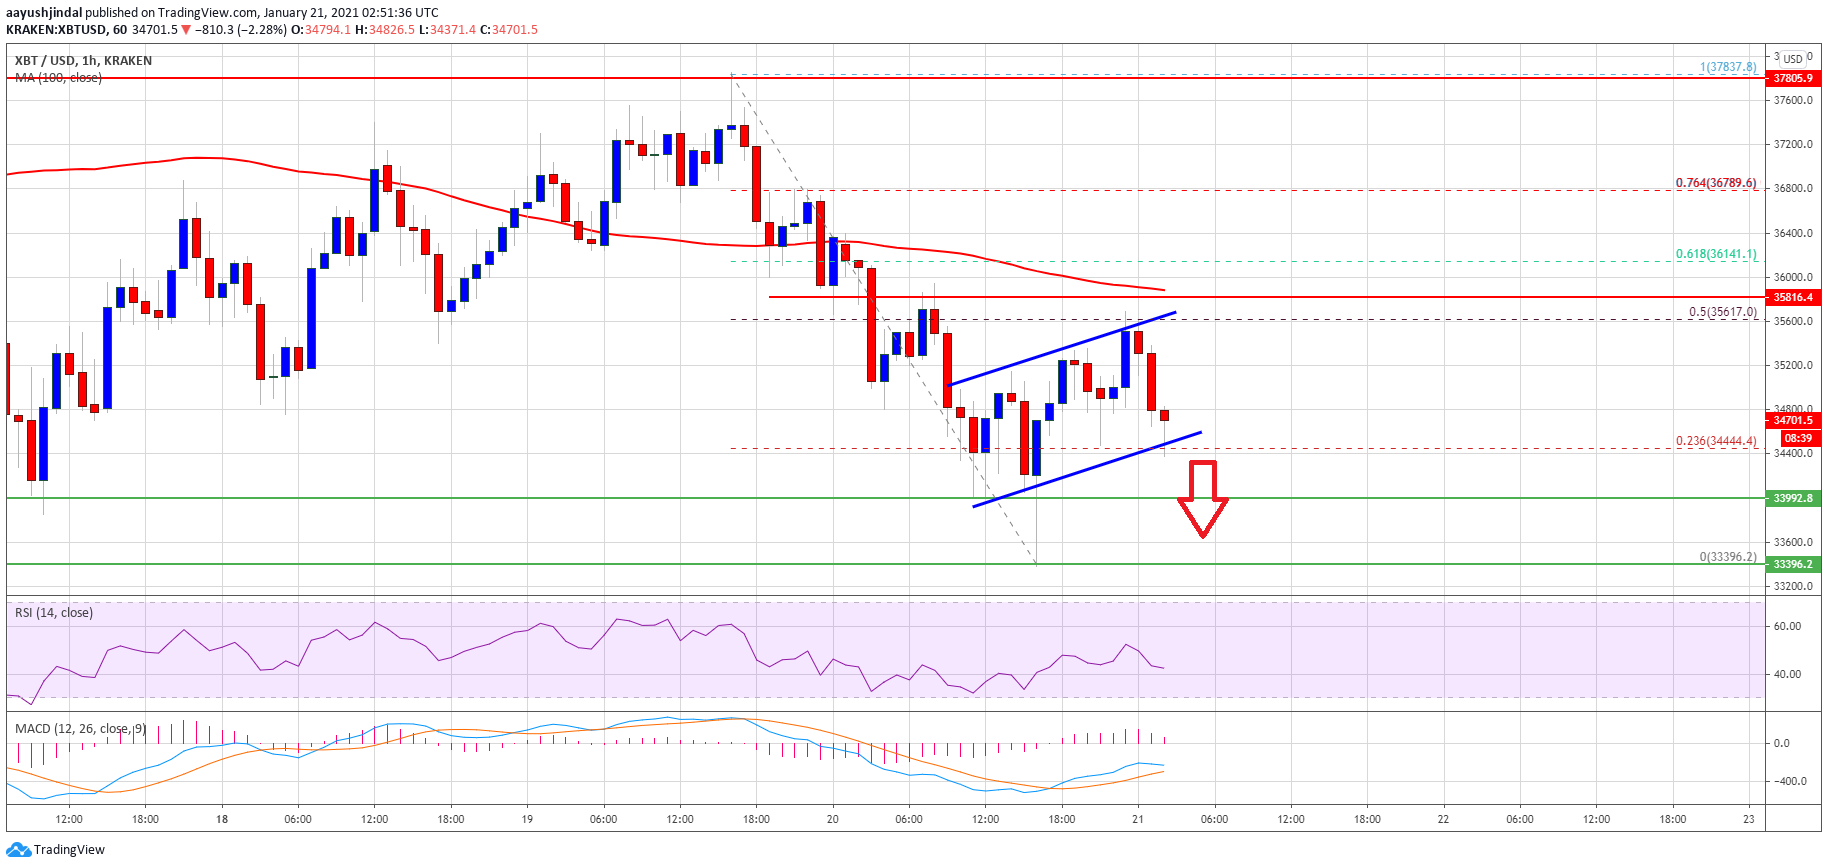
Source: BTCUSD on TradingView.com
The price is now gaining bearish momentum below $35,500 and the 100 hourly simple moving average. There is also a key rising channel forming with support near $34,550 on the hourly chart of the BTC/USD pair. If there is a clear break below the channel support, the price might decline sharply below the $34,000 support.
The next key support is near the $33,300 and $33,250 levels, below which the bears are likely to aim a test of the $32,000 level.
Fresh Increase in BTC?
If bitcoin starts a fresh upward move, an initial resistance is near the $35,200 level. The first major resistance is near the $35,800 level and the 100 hourly simple moving average.
To move into a positive zone, the price must clear the $35,800 and $36,000 resistance levels. A successful close above the $36,000 resistance could open the doors for a push towards the $37,500 level.
Technical indicators:
Hourly MACD – The MACD is slowly gaining momentum in the bearish zone.
Hourly RSI (Relative Strength Index) – The RSI for BTC/USD is now close to the 40 level.
Major Support Levels – $34,000, followed by $33,300.
Major Resistance Levels – $35,800, $36,000 and $37,500.