
Reason to trust
How Our News is Made
Strict editorial policy that focuses on accuracy, relevance, and impartiality
Ad discliamer
Morbi pretium leo et nisl aliquam mollis. Quisque arcu lorem, ultricies quis pellentesque nec, ullamcorper eu odio.
Bitcoin price extended its decline below the $38,000 support zone against the US Dollar. BTC is now showing signs of an upside correction as long as it is above $38,000.
- Bitcoin extended its decline below the $39,000 and $38,000 support levels.
- The price is now trading well below $39,000 and the 100 hourly simple moving average.
- There was a break above a crucial bearish trend line with resistance near $38,200 on the hourly chart of the BTC/USD pair (data feed from Kraken).
- The pair could start a decent increase as long as there is no daily close below $38,000.
Bitcoin Price is Consolidating
Bitcoin price extended its decline below the $39,200 and $39,000 support levels. BTC even broke the $38,500 level to move further into a bearish zone.
The price spiked below the $38,000 support level and it settled well below the 100 hourly simple moving average. A low is formed near $37,660 and the price is now attempting an upside correction. There was a break above the $38,000 level.
Besides, there was a break above a crucial bearish trend line with resistance near $38,200 on the hourly chart of the BTC/USD pair. Bitcoin is now facing resistance near the $38,800 level.
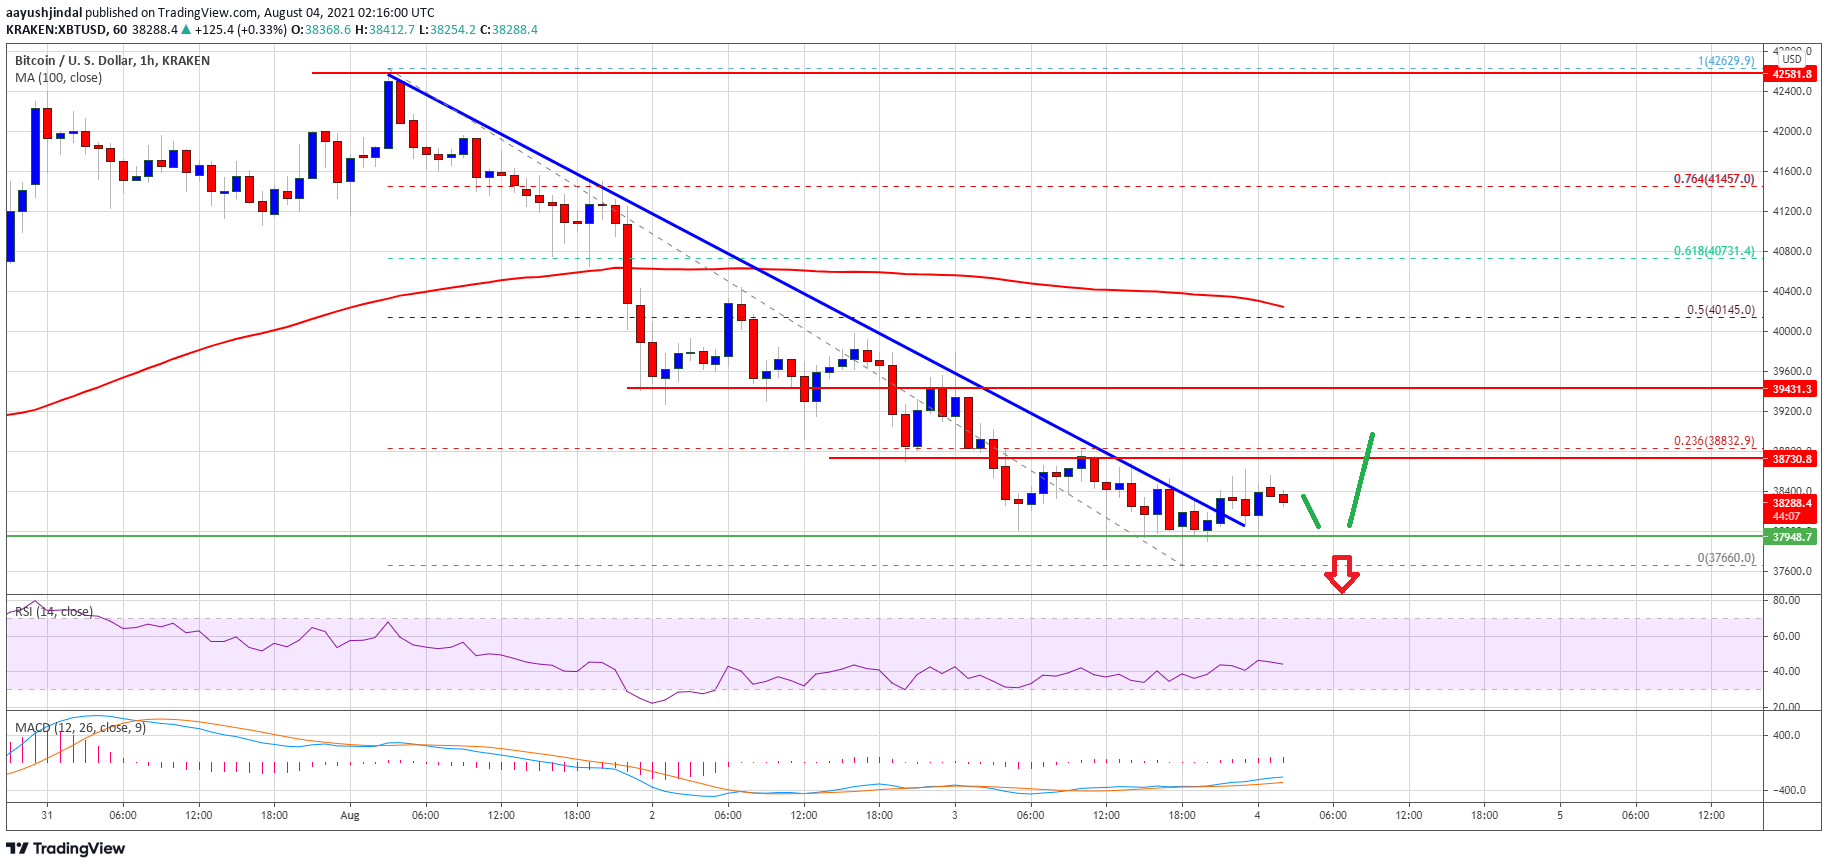
Source: BTCUSD on TradingView.com
It is close to the 23.6% Fib retracement level of the key drop from the $42,630 swing high to $37,660 low. The next major resistance is near the $39,500 level. The main resistance is now forming near the $40,000 level and the 100 hourly simple moving average.
It is near the 50% Fib retracement level of the key drop from the $42,630 swing high to $37,660 low. If there is an upside break above $38,800 and $40,000, bitcoin could gain traction. The next major resistance on the upside is near the $41,450 zone.
More Losses in BTC?
If bitcoin fails to climb above the $38,800 and $40,000 resistance levels, it could continue to move down. An initial support on the downside is near the $38,000 level.
The first major support is now near the $37,800 zone. A clear downside break below the $37,800 support might call for more losses. The next major support is near the $37,000 zone.
Technical indicators:
Hourly MACD – The MACD is slowly losing pace in the bearish zone.
Hourly RSI (Relative Strength Index) – The RSI for BTC/USD is still well below the 50 level.
Major Support Levels – $38,000, followed by $37,000.
Major Resistance Levels – $38,880, $39,500 and $40,000.