
Reason to trust
How Our News is Made
Strict editorial policy that focuses on accuracy, relevance, and impartiality
Ad discliamer
Morbi pretium leo et nisl aliquam mollis. Quisque arcu lorem, ultricies quis pellentesque nec, ullamcorper eu odio.
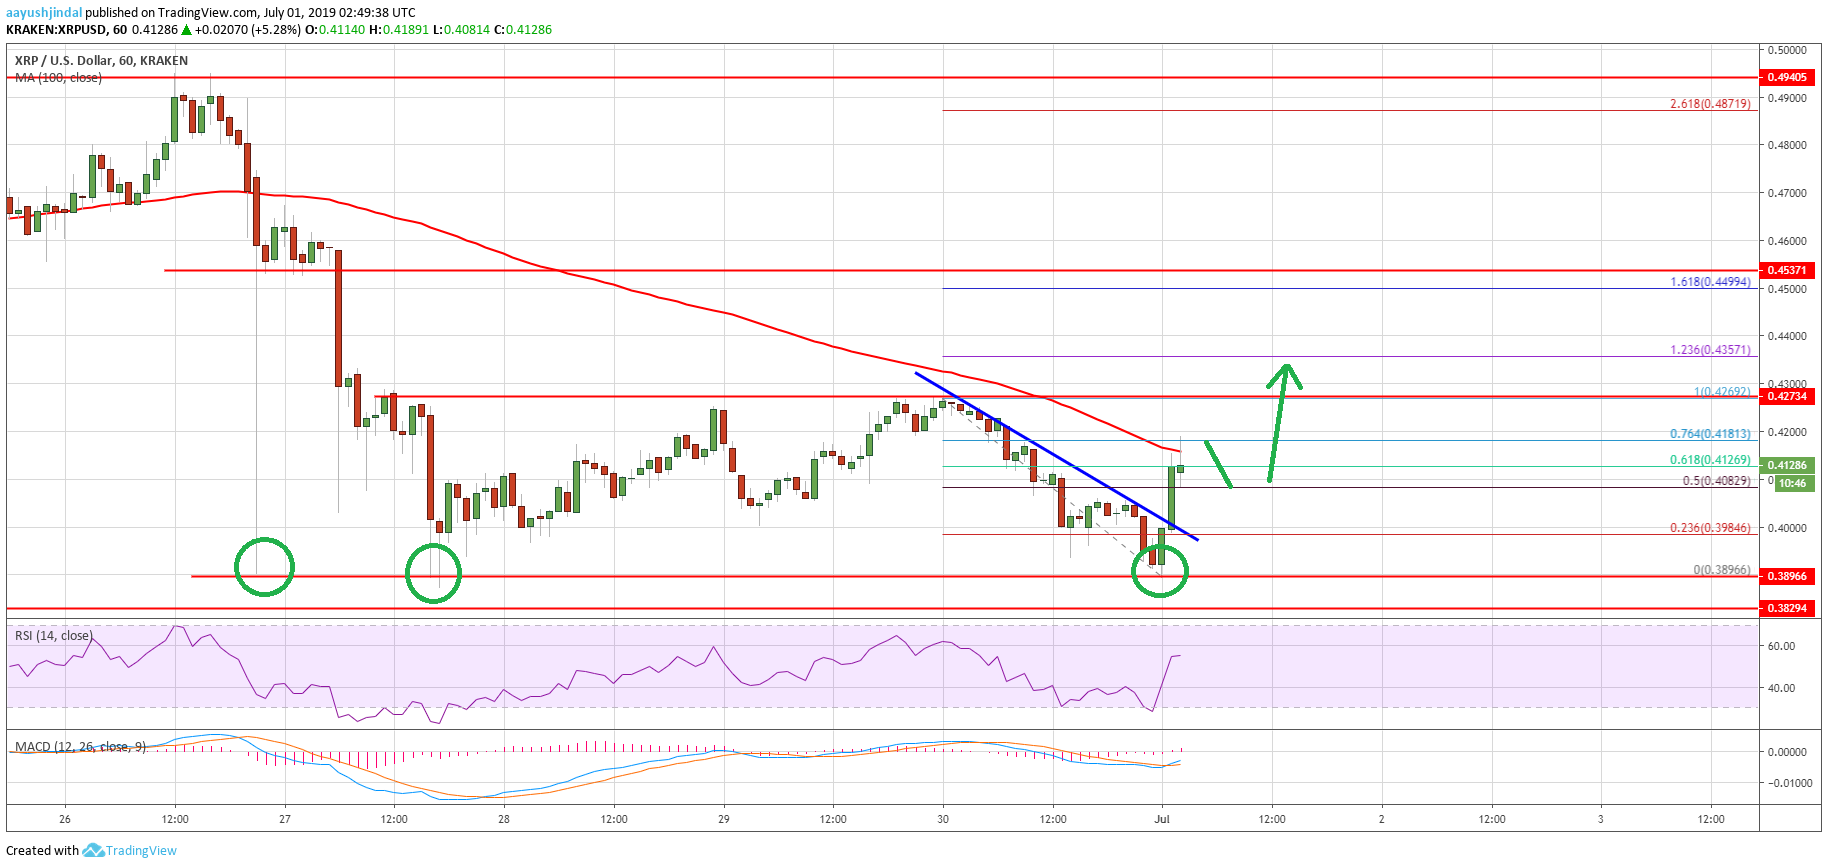
- Ripple price retested the main $0.3900 support area and climbed higher against the US dollar.
- The price is likely forming a decent support base above $0.3900 and it might rise in the near term.
- There was a break above a major bearish trend line with resistance near $0.4000 on the hourly chart of the XRP/USD pair (data source from Kraken).
- Ethereum price is holding the key $290 support, but it seems to be facing many hurdles near $305-310.
Ripple price is likely forming a strong support base near $0.3900 against the US Dollar, while bitcoin declined heavily. XRP price could continue to rise if it clears the $0.4275 resistance.
Ripple Price Analysis
In the past few hours, bitcoin price declined more than 8% below $11,500, but ripple price was stable against the US Dollar. Earlier, the XRP/USD pair declined towards the main $0.3900 support area and settled below the 100 hourly simple moving average. However, the $0.3900 zone acted as a strong barrier for sellers and the price stayed above $0.3900.
It seems like a solid support base is forming near $0.3900. Recently, the price started an upward move and broke the $0.4000 resistance. Moreover, the price surpassed the 50% Fib retracement level of the last decline from the $0.4269 high to $0.3896 low. More importantly, there was a break above a major bearish trend line with resistance near $0.4000 on the hourly chart of the XRP/USD pair.
Ripple price is now trading near the $0.4110 level. It tested the $0.4200 resistance and the 100 hourly SMA. Moreover, the 76.4% Fib retracement level of the last decline from the $0.4269 high to $0.3896 low is also acting as a resistance. If there is an upside break above the $0.4200 resistance, the price could test the $0.4275 resistance.
If there are more gains above $0.4275, there are chances of an upside break above the $0.4300 level. The next main hurdles are near $0.4450 and $0.4500. Conversely, if the price fails to clear the $0.4275 resistance, it could decline once again. An initial support is near the $0.4000 level.
 a
a
Looking at the chart, ripple price is clearly forming a strong support near the $0.3900 level. As long as the price is above $0.3900 and $0.4000, there are chances of a fresh increase above the $0.4275 resistance. If there is a downside break below $0.3900, the price could slide towards $0.3500.
Technical Indicators
Hourly MACD – The MACD for XRP/USD is moving back in the bullish zone.
Hourly RSI (Relative Strength Index) – The RSI for XRP/USD is currently moving higher and it is above the 50 level.
Major Support Levels – $0.4000, $0.3900 and $0.3500.
Major Resistance Levels – $0.4200, $0.4275 and $0.4400.


