
Reason to trust
How Our News is Made
Strict editorial policy that focuses on accuracy, relevance, and impartiality
Ad discliamer
Morbi pretium leo et nisl aliquam mollis. Quisque arcu lorem, ultricies quis pellentesque nec, ullamcorper eu odio.
- Ripple price traded to a new monthly low at $0.3810 and corrected higher support against the US dollar.
- The price is struggling to gain bullish momentum and it is still trading well below $0.4275.
- Yesterday’s highlighted key bearish trend line was breached with resistance near $0.3985 on the hourly chart of the XRP/USD pair (data source from Kraken).
- Ethereum price is currently recovering and it is already trading above the key $292 resistance.
Ripple price is still facing a lot of hurdles against the US Dollar, while bitcoin rallied more than 8%. XRP price could slowly rise, but it might struggle near $0.4120 or $0.4200.
Ripple Price Analysis
After a strong decline, bitcoin price found support near $9,700 and recently rallied above $11,000, but ripple price remained in a bearish zone against the US Dollar. Earlier, the XRP/USD pair extended losses below the $0.2900 and $0.2850 levels. A new monthly low was formed near $0.3810 before the price started a fresh recovery. It broke the $0.3900 and $0.3920 resistance levels.
Moreover, yesterday’s highlighted key bearish trend line was breached with resistance near $0.3985 on the hourly chart of the XRP/USD pair. The pair even climbed above the 61.8% Fib retracement level of the last decline from the $0.4085 high to $0.3810 low. However, ripple price is now facing resistance near the $0.4050 level and the 100 hourly simple moving average.
A successful close above the $0.4050 resistance might push the price further higher. An immediate resistance could be near the $0.4085 or $0.4100 level. The next resistance could be $0.4150. Moreover, the 1.236 Fib extension level of the last decline from the $0.4085 high to $0.3810 low is also near the $0.4145 level. If the bulls gain pace, ripple price might revisit the $0.4200 or $0.4200 resistance.
If the price struggles to move above $0.4050 or $0.4100, it could decline once again. An immediate support is near the $0.4000 level. A downside break below $0.4000 might open the doors for more losses towards the $0.3850 or $0.3800 levels.
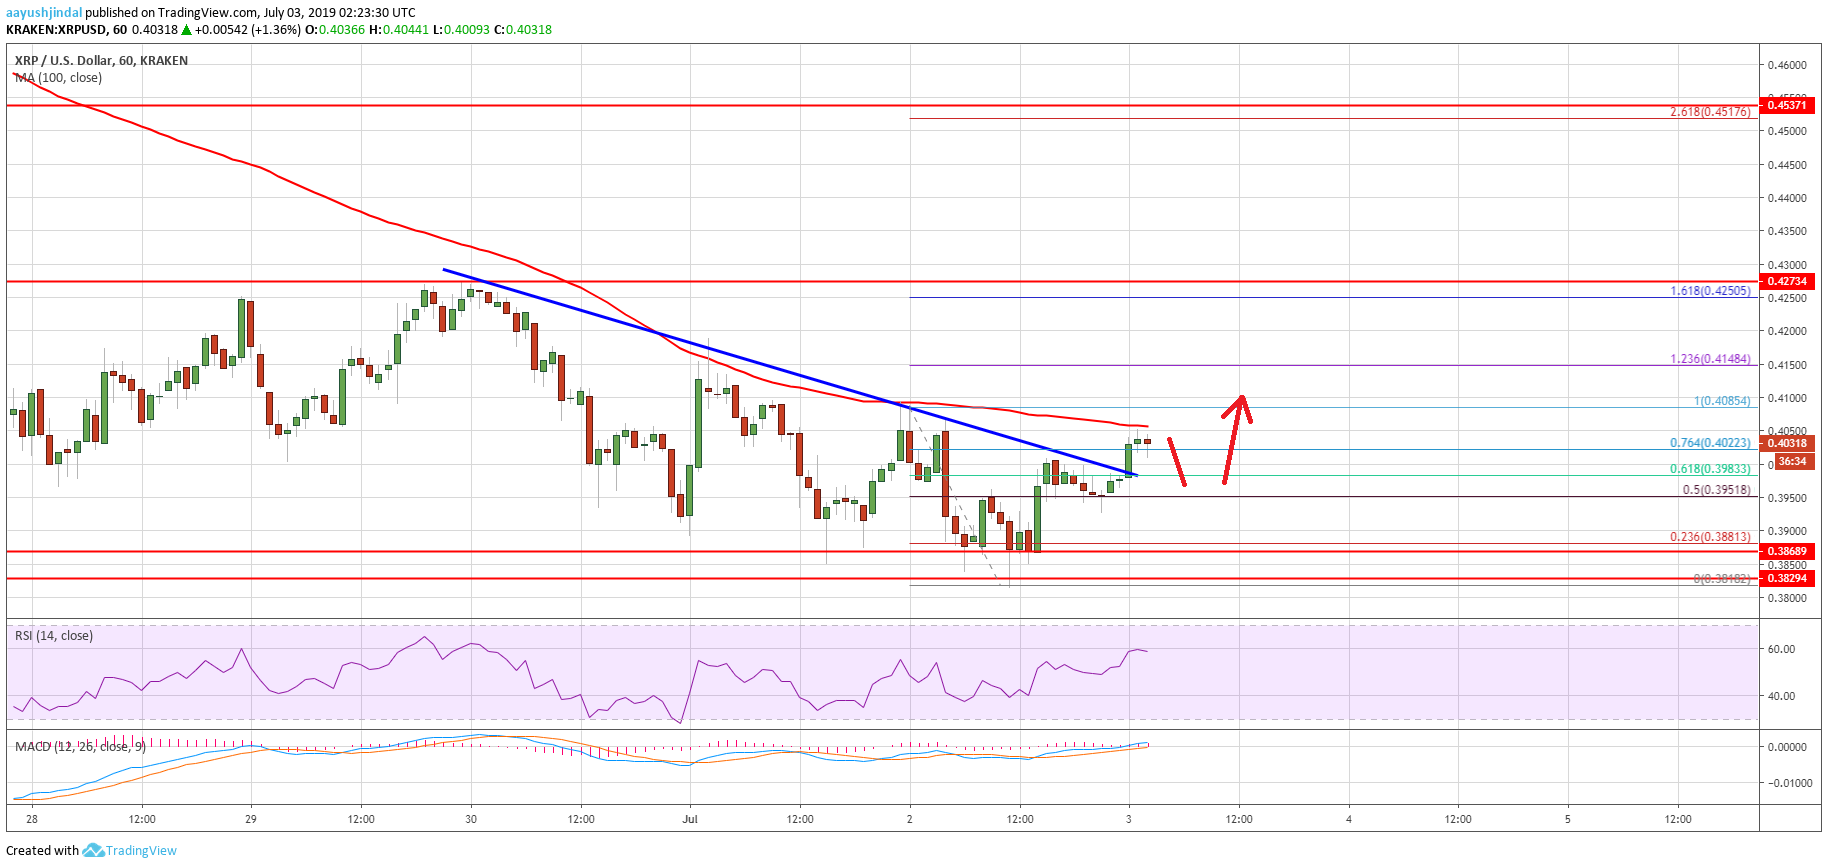
Looking at the chart, ripple price is slowly recovering above $0.4000. However, a convincing close above $0.4050 plus the 100 hourly SMA is needed for more gains. Besides, if bitcoin continues its rise, there are chances of a slow and steady rise in altcoins. The next stop for XRP might be $0.4275, which is the main resistance for this week.
Technical Indicators
Hourly MACD – The MACD for XRP/USD is slowly moving in the bullish zone.
Hourly RSI (Relative Strength Index) – The RSI for XRP/USD is currently well above the 50 and 55 levels.
Major Support Levels – $0.4000, $0.3920 and $0.3850.
Major Resistance Levels – $0.4050, $0.4100 and $0.4150.