Key Points
- Bitcoin price spiked this past week and moved above the $6000 handle against the US Dollar.
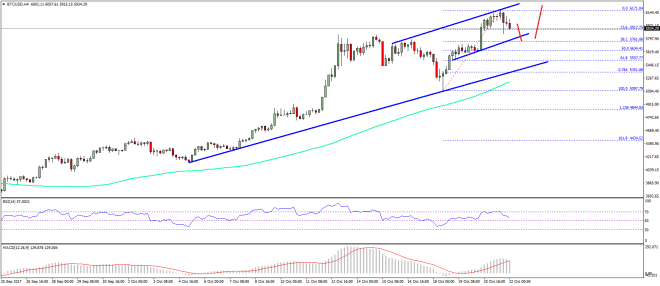
- There is a monster bullish trend line forming with support at $5510 on the 4-hours chart of BTC/USD (data feed from SimpleFX).
- The pair is currently correcting lower and approaching towards the $5750 support area.
Bitcoin price remains in a major uptrend above $5600 against the US Dollar. BTC/USD might even trade past $6200 in the near term.
Bitcoin Price Uptrend Intact
This past week was mainly bullish for Bitcoin price as it moved above the $6000 handle against the US Dollar. A new all-time high was formed near $6170 as buyers were completely in control. Earlier, there was a dip from the $5750 swing high towards the $5100 handle where buyers emerged. Mainly, a monster bullish trend line with current support at $5510 on the 4-hours chart of BTC/USD prevented declines. It acted as a major support zone above $5100.
The pair spiked higher and traded as high as $6171. At the moment, the pair is correcting lower and trading near the 23.6% Fib retracement level of the last wave from the $5097 low to $6171 high. A resistance trend line acted as a barrier for more gains near $6170 and ignited a correction. On the downside, there is a short-term trend line with support at $5750.
The trend line support is also close to the 38.2% Fib retracement level of the last wave from the $5097 low to $6171 high. Therefore, any dips from the current levels remain supported near $5750. Below $5750, the main bullish trend line at $5510 might come into the picture. The overall trend remains bullish as long as the price is above $5500.
Looking at the technical indicators:
4-hours MACD – The MACD is strongly placed in the bullish zone.
4-hours RSI (Relative Strength Index) – The RSI is currently moving towards the 55-50 levels.
Major Support Level – $5750
Major Resistance Level – $6170
Charts courtesy – SimpleFX


