That is the end of another day in our bitcoin price trading efforts and we have had a pretty good one. In this morning’s analysis, we noted that our primary focus was on maintaining our breakout entries. Specifically, we were looking to get in on a break of (ideally) resistance or (if not) support and stay with the market as it ran towards a relatively aggressive target in line with our entry.
That was pretty much exactly what we got. Price broke through our predefined resistance level shortly after we published our first analysis of the day and immediately ran up to our upside target. We took a nice profit that the market and have since remained flat (i.e. no positions) in response to the subsequent sideways trading we have seen from the market this afternoon.
Going forward, we are going to try and implement pretty much the exact same strategy.
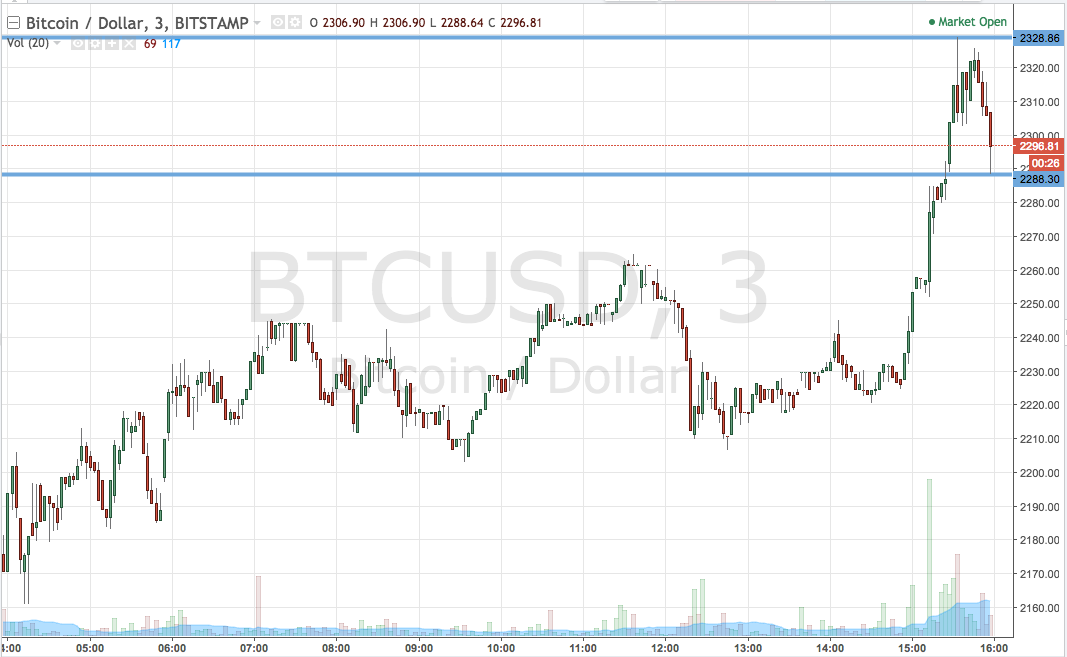
So, with this noted, and as we move into the evening session out of Europe today, take a quick look at the chart to get an idea of what is on and where we are looking to get in and out of the markets according to the rules of our intraday strategy. It is a three-minute candlestick chart and it has our range overlaid in blue.

As the chart shows, the range we are looking at this evening is defined by support to the downside at 2288 and resistance to the upside at 2328. Just as we did this morning, we are going to leave intrarange on the shelf for now and focus on our breakout entries. So, if we see price close above resistance, we will be in long towards an upside target of 2350. A stop loss on the trade at 2320 looks good. Conversely, a close below support will have us in short towards 2250.
Charts courtesy of Trading View


