Reason to trust

How Our News is Made
Strict editorial policy that focuses on accuracy, relevance, and impartiality
Ad discliamer
Morbi pretium leo et nisl aliquam mollis. Quisque arcu lorem, ultricies quis pellentesque nec, ullamcorper eu odio.
So we’re closing out on the European session today and it’s time to take the second of our twice daily looks at how action in the bitcoin price played out and how we can use it to formulate some sort of strategy that we can use to try and draw a profit from the market this evening.
We’ve been hit with a substantial amount of negative sentiment over the last week or so and this has translated to some real weakness in price. Right now, BTC is trading more than 50% down on its highs (early January) and just how things have got to fall farther is anyone’s guess.
There has to be a point at which the portion of the market represented by long-term holders matches, or rises above, the portion that represents speculative short-term interest. At that point, we’ll see price bottom out and the market start to recover.
Price has bounced from here in the past, suggesting there’s some degree of support that exists at this level. The hope is that it can hold firm once again and the support can validate itself long term.
Anyway, let’s get some levels in place that we can use for the session this evening and see what we can do with the action we get.
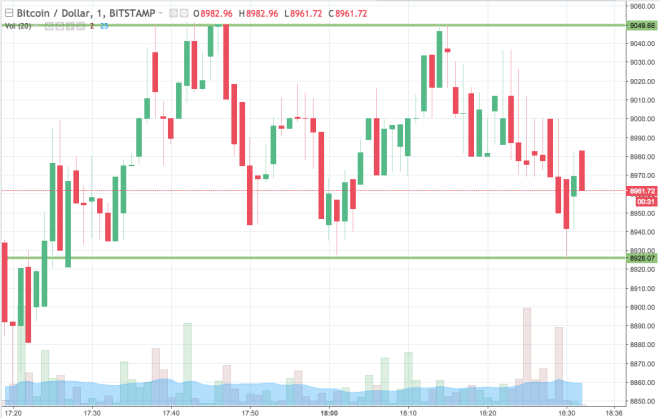
As ever, take a quick look at the chart below to get an idea where things stand. It’s a one-minute candlestick chart and it’s got our primary range overlaid in green.

As the chart shows, the range that we’re looking at for the session today comes in as defined by support to the downside at 8926 and resistance to the upside at 8949.
We’ll be looking at getting in long on a close above resistance towards an immediate upside target of 9200.
Conversely, a close below support will have us in short towards 8800.
Let’s see what happens.
Charts courtesy of Trading View


You are the worst analyst ever. Your ranges are so small that that there is no point in following them and you finish off by saying “lets see what happens”. Then what’s the point? A close below 8949 will have short towards 8800??? Like no sht.
The ranges have nothing to do with the analyst, it’s a consequence of the current uncertainty of the market. You can’t form strong trend lines when market is operating at low volume. There isn’t enough momentum and the market becomes bearish fighting to stay above the very weak support level established a few weeks ago at the 8,000+ level
how about trading fees? the ranges published are a joke
A lot of people use zero fee trading. You kind of need to when a market is sliding downward.
I’m not sure what people want. Should the author use ranges with higher returns even if the risk high and the data doesn’t support them?
The author should have placed more emphasis on the fact that the charts suggest that things are likely to get worse, so even this type of day trading is risky. Newsbtc does have a habit of focusing on very short windows, which is why they publish twice daily. The analysis is really only useful right when it comes out. They might want to make that clearer
It is more like death by 1000 cuts…there IS some major volume that typically acts to either spike or drop any major trend…which is then followed by long periods of low volume sell off. Translation: the weak hands are being played by the fat cats. You need a buyer for every sale…and how much better to buy at a very low price? This won’t end until the newbies and weak hands are gone. Period. The new registrations almost doubled in December and Jan…that is where much of your price drop and uncertainty are: and you do not need technical analysis to figure it out.