We’re closing in on the end of the session today in our bitcoin price trading efforts and what a session it’s been. Things really started to move shortly after we published our initial coverage and haven’t slowed down since. It’s not all been to the upside, unfortunately, but as the more regular of our readers will know, we are in a position to take advantage of action both to the upside and the downside, so that things have weakened a bit during the session isn’t too much of a big deal.
As we move into the end of the European session, then, and into the US session afternoon, here’s a look at what we’re going for and where we’re hoping to jump in and out of the markets as and when things move.
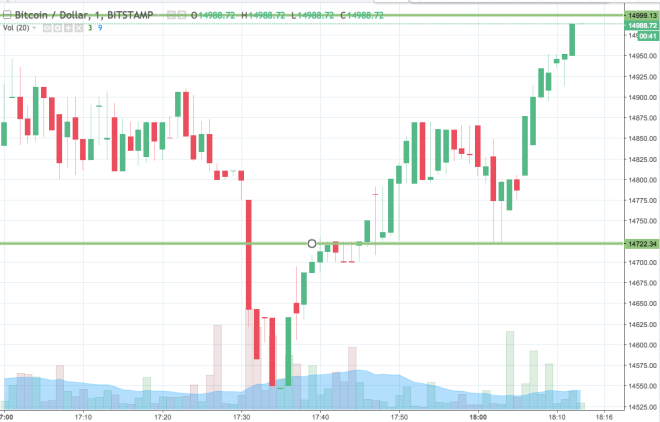
Before we get started, take a quick look at the chart below so as to get an idea what’s on and where we’ve placed our key levels. It’s a one-minute candlestick chart and it’s got our primary range overlaid in green.

As the chart shows, then, the range that we are using for the session this evening comes in as defined by support to the downside at 14722 and resistance to the upside at 15000.
We are going to employ our standard breakout strategy for the session, so we’ll look at getting into a long trade first on a close above resistance. We’ll enter with an initial target of 15150 on the trade and we’ll use a stop loss in and around 14950 to ensure we get taken out of the trade if things turn against us.
Looking the other way, if we see a close below support, we’ll jump into a short entry towards an immediate downside target of 14600. A stop on this one at 14760 looks good.
Charts courtesy of Trading View


Do you guys work on a 1 hour timeline?
How do you short it?