Reason to trust
How Our News is Made
Strict editorial policy that focuses on accuracy, relevance, and impartiality
Ad discliamer
Morbi pretium leo et nisl aliquam mollis. Quisque arcu lorem, ultricies quis pellentesque nec, ullamcorper eu odio.
Key Points
- Bitcoin price declined below $4,000 and $3,600 before buyers appeared against the US Dollar.
- There is a major bearish trend line in place with resistance at $4,080 on the hourly chart of the BTC/USD pair (data feed from Kraken).
- The price must break the $4,000 and $4,080 resistance to climb higher in the near term.
Bitcoin price nosedived below $4,000 and $3,800 against the US Dollar. BTC/USD is currently recovering, but the $4,000 barrier is now acting as a resistance.
Bitcoin Price Analysis
During the past three days, we saw a nasty decline below $4,000 in bitcoin price against the US Dollar. The BTC/USD pair even broke the $3,800 and $3,600 support levels to post a new multi month low. The price even spiked below the $3,500 level and settled well below the 100 hourly simple moving average. A low was formed at $3,449 and later the price started an upside correction.
It moved above the $3,600 and $3,800 resistance levels. More importantly, there was a break above the 50% Fib retracement level of the recent decline from the $4,340 high to $3,449 low. However, the upside move was capped by the $4,080-4,100 zone, which was a support earlier. Moreover, there is a major bearish trend line in place with resistance at $4,080 on the hourly chart of the BTC/USD pair. The pair was also rejected near the 76.4% Fib retracement level of the recent decline from the $4,340 high to $3,449 low. Clearly, the price is facing a solid resistance near the $4,080 level and the 100 hourly SMA.
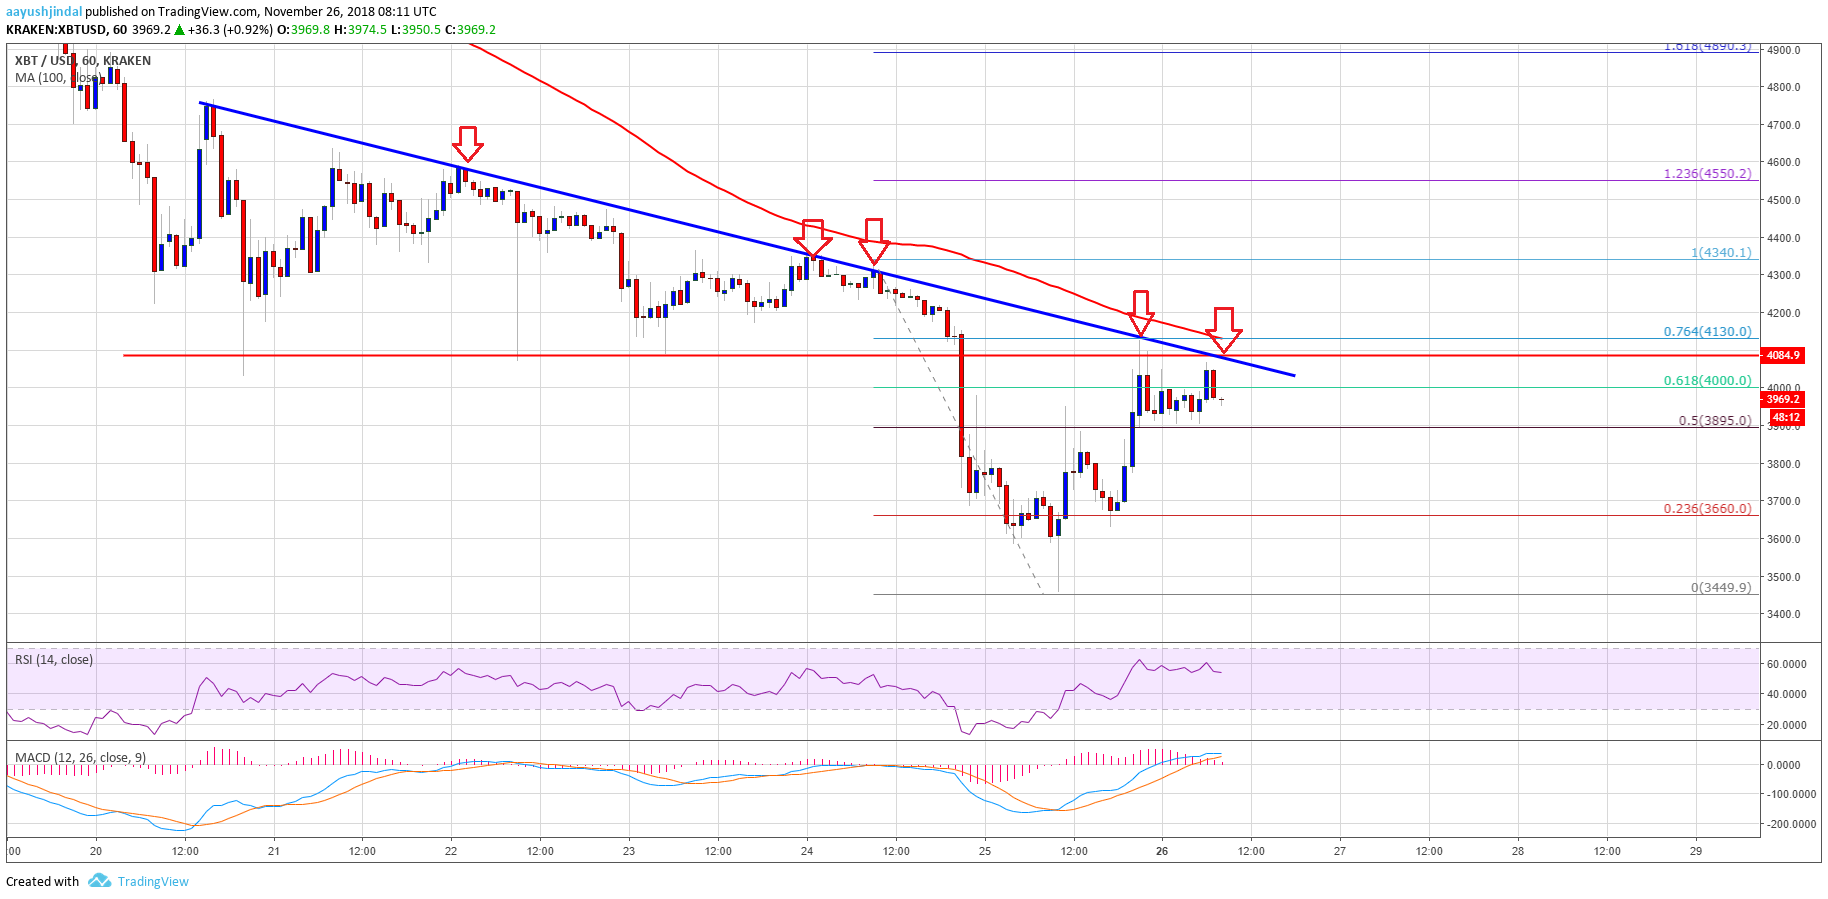
Looking at the chart, bitcoin price must break the $4,000 and $4,080 resistance to climb higher towards $4,500. If buyers fail to gain pace above $4,080 and the 100 hourly SMA, there could be a sharp decline.
Looking at the technical indicators:
Hourly MACD – The MACD for BTC/USD is slowly moving in the bullish zone.
Hourly RSI (Relative Strength Index) – The RSI is currently well above the 50 level.
Major Support Level – $3,800
Major Resistance Level – $4,080