
Reason to trust
How Our News is Made
Strict editorial policy that focuses on accuracy, relevance, and impartiality
Ad discliamer
Morbi pretium leo et nisl aliquam mollis. Quisque arcu lorem, ultricies quis pellentesque nec, ullamcorper eu odio.
Key Points
- Bitcoin price declined further and broke the $3,550 and $3,420 support levels against the US Dollar.
- There is a major bearish trend line formed with resistance at $3,700 on the hourly chart of the BTC/USD pair (data feed from Kraken).
- The price is likely to decline further and it may even test the $3,000 level in the near term.
Bitcoin price declined heavily below $3,550 against the US Dollar. BTC/USD remains in a downtrend and it could even trade towards $3,000 or $2,800.
Bitcoin Price Analysis
After forming a short term support near $3,550, there was a tiny recovery in bitcoin price against the US Dollar. The BTC/USD pair traded above the $3,750 level, but upsides were capped near the $3,845 level. Finally, there was a fresh decline and the price traded below the $3,550 and $3,420 support levels. It is now trading well below the $3,750 level and the 100 hourly simple moving average.
A new multi month low was formed at $3,288 and the price is currently consolidating losses. An initial resistance is the 23.6% Fib retracement level of the last drop from the $3,849 high to $3,288 low. However, there are many resistances on the upside near $3,550 and $3,555. The previous support near $3,550 is a major hurdle. It coincides with the 50% Fib retracement level of the last drop from the $3,849 high to $3,288 low. Moreover, there is a major bearish trend line formed with resistance at $3,700 on the hourly chart of the BTC/USD pair.
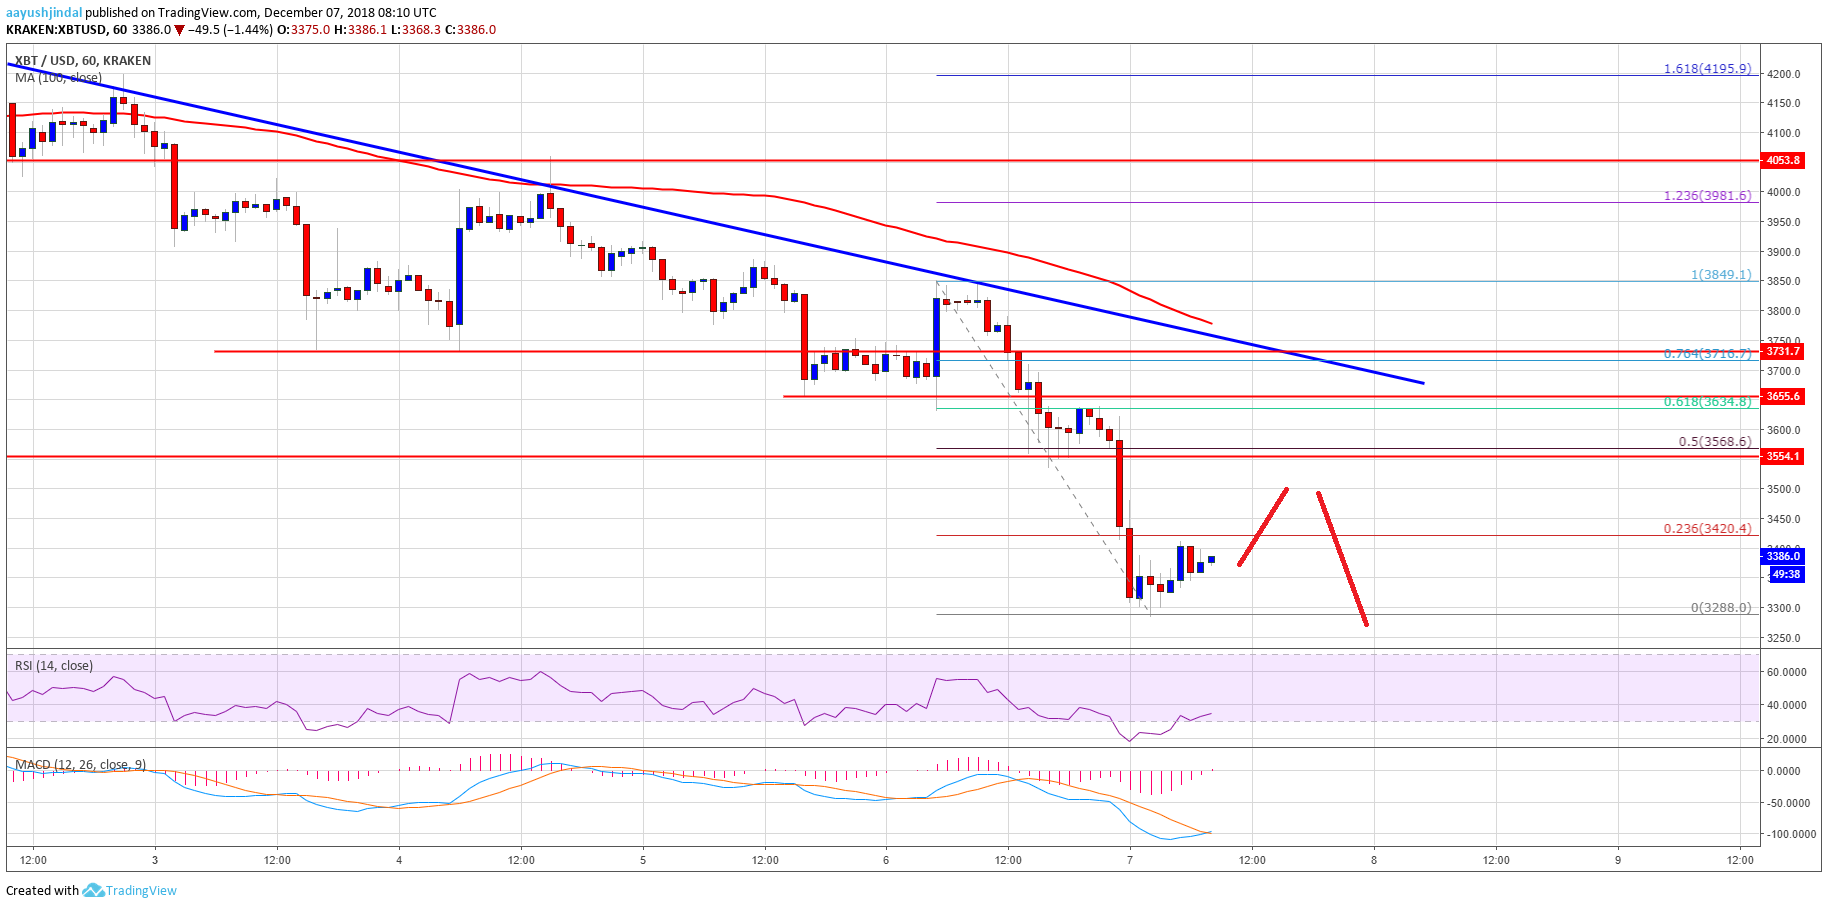
Looking at the chart, bitcoin price is clearly placed in a nasty downtrend below $3,550. As long as it is trading below $3,750, there could be more losses. The next stop for sellers below $3,250 may be $3,000 or even $2,800.
Looking at the technical indicators:
Hourly MACD – The MACD for BTC/USD is slowly reducing its bearish slope.
Hourly RSI (Relative Strength Index) – The RSI is moving higher towards the 40 level.
Major Support Level – $3,250
Major Resistance Level – $3,550


