
Reason to trust
How Our News is Made
Strict editorial policy that focuses on accuracy, relevance, and impartiality
Ad discliamer
Morbi pretium leo et nisl aliquam mollis. Quisque arcu lorem, ultricies quis pellentesque nec, ullamcorper eu odio.
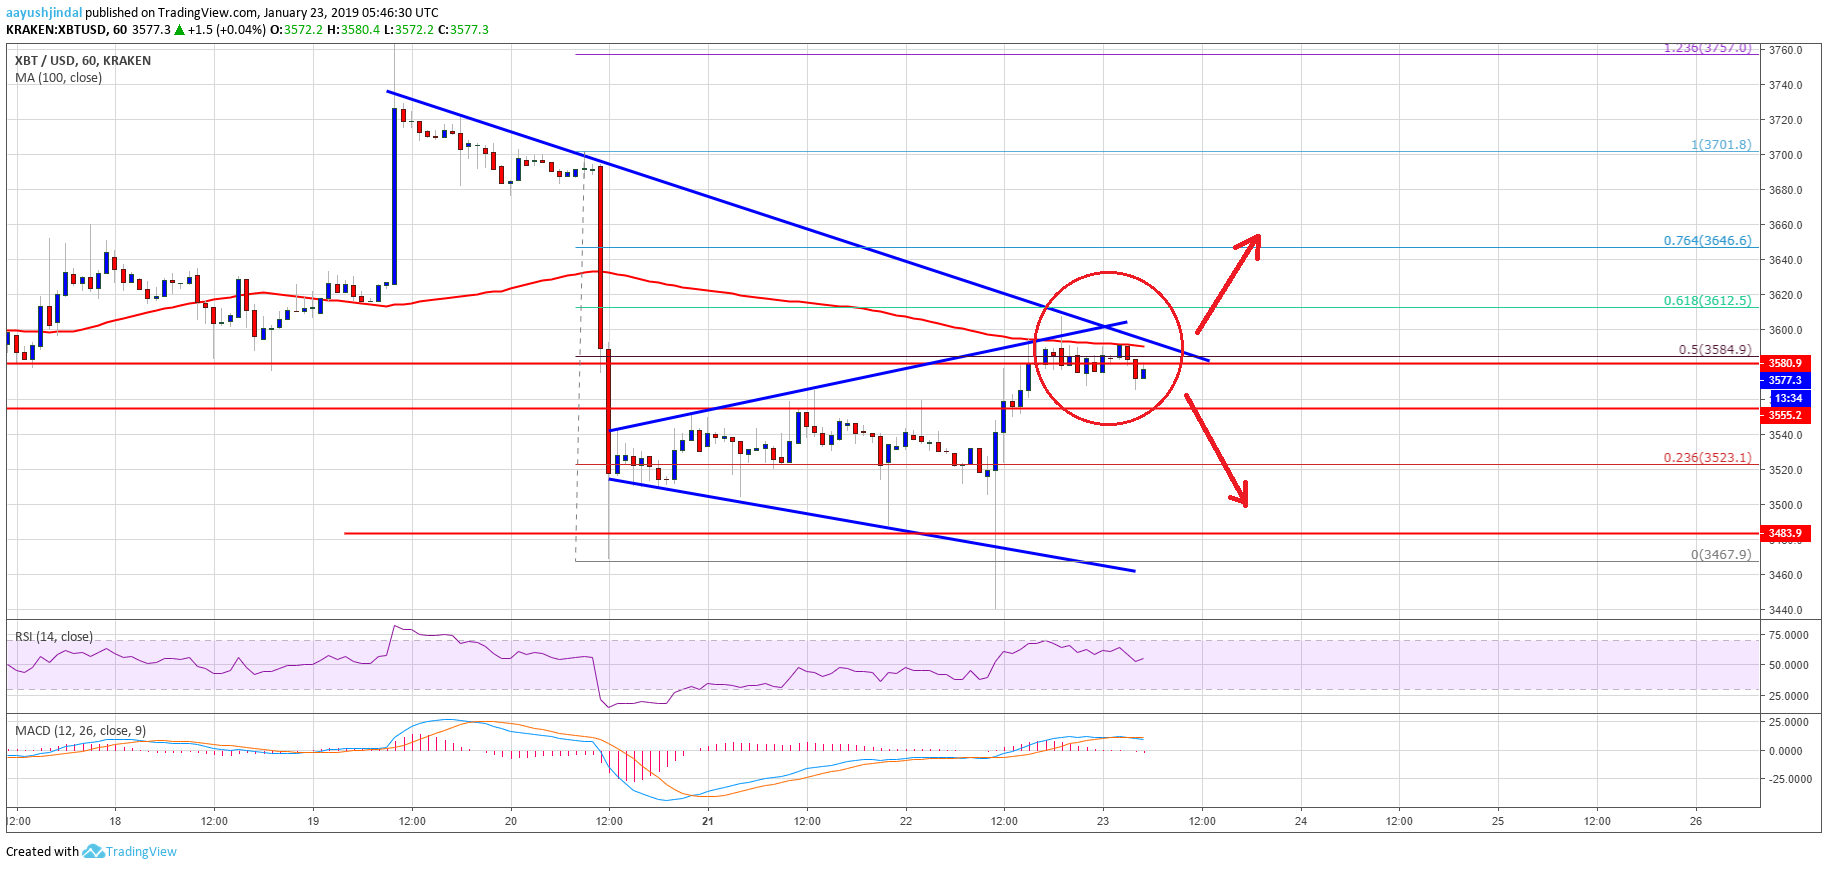
- Bitcoin price climbed higher sharply after diving below the $3,480 support level against the US Dollar.
- Yesterday’s highlighted key bearish trend line is intact with resistance near $3,600 on the hourly chart of the BTC/USD pair (data feed from Kraken).
- The price is facing a crucial resistance near $3,600, above which it could rally towards $3,700 or $3,750.
Bitcoin price is showing positive signs above the $3,520 level support against the US Dollar. Having said that, BTC is struggling to clear the key $3,600 resistance level.
Bitcoin Price Analysis
Yesterday, we discussed the chances of more losses below the $3,500 level in bitcoin price against the US Dollar. The BTC/USD pair did decline below the $3,500 and $3,480 support levels. The pair spiked towards the $3,450 level and later bounced back. Buyers were successful in pushing the price back above $3,480 and $3,500. It can be considered as a false break since there was no hourly close below $3,480. The recent recovery was solid above $3,550 and the 50% Fib retracement level of the downside move from the $3,700 swing high to $3,465 low.
However, the price ran into a significant resistance near $3,600 and the 100 hourly simple moving average. More importantly, yesterday’s highlighted key bearish trend line is intact with resistance near $3,600 on the hourly chart of the BTC/USD pair. Finally, the 61.8% Fib retracement level of the downside move from the $3,700 swing high to $3,465 low is also acting as a hurdle. Therefore, there are two possible scenarios, with the pivot level at $3,600. First, the price breaks the trend line and $3,600 to start a solid upward move. Second, buyers fail to gain traction above $3,600, resulting in a drop back to $3,500.
Looking at the chart, bitcoin price seems to be trading near a crucial juncture at $3,600. There are high chances of more gains, but it won’t be easy for buyers to clear the $3,600 barrier.
Technical indicators
Hourly MACD – The MACD for BTC/USD is slowly moving back in the bearish zone.
Hourly RSI (Relative Strength Index) – The RSI for BTC/USD is currently placed nicely above the 50 level.
Major Support Level – $3,500
Major Resistance Level – $3,600


