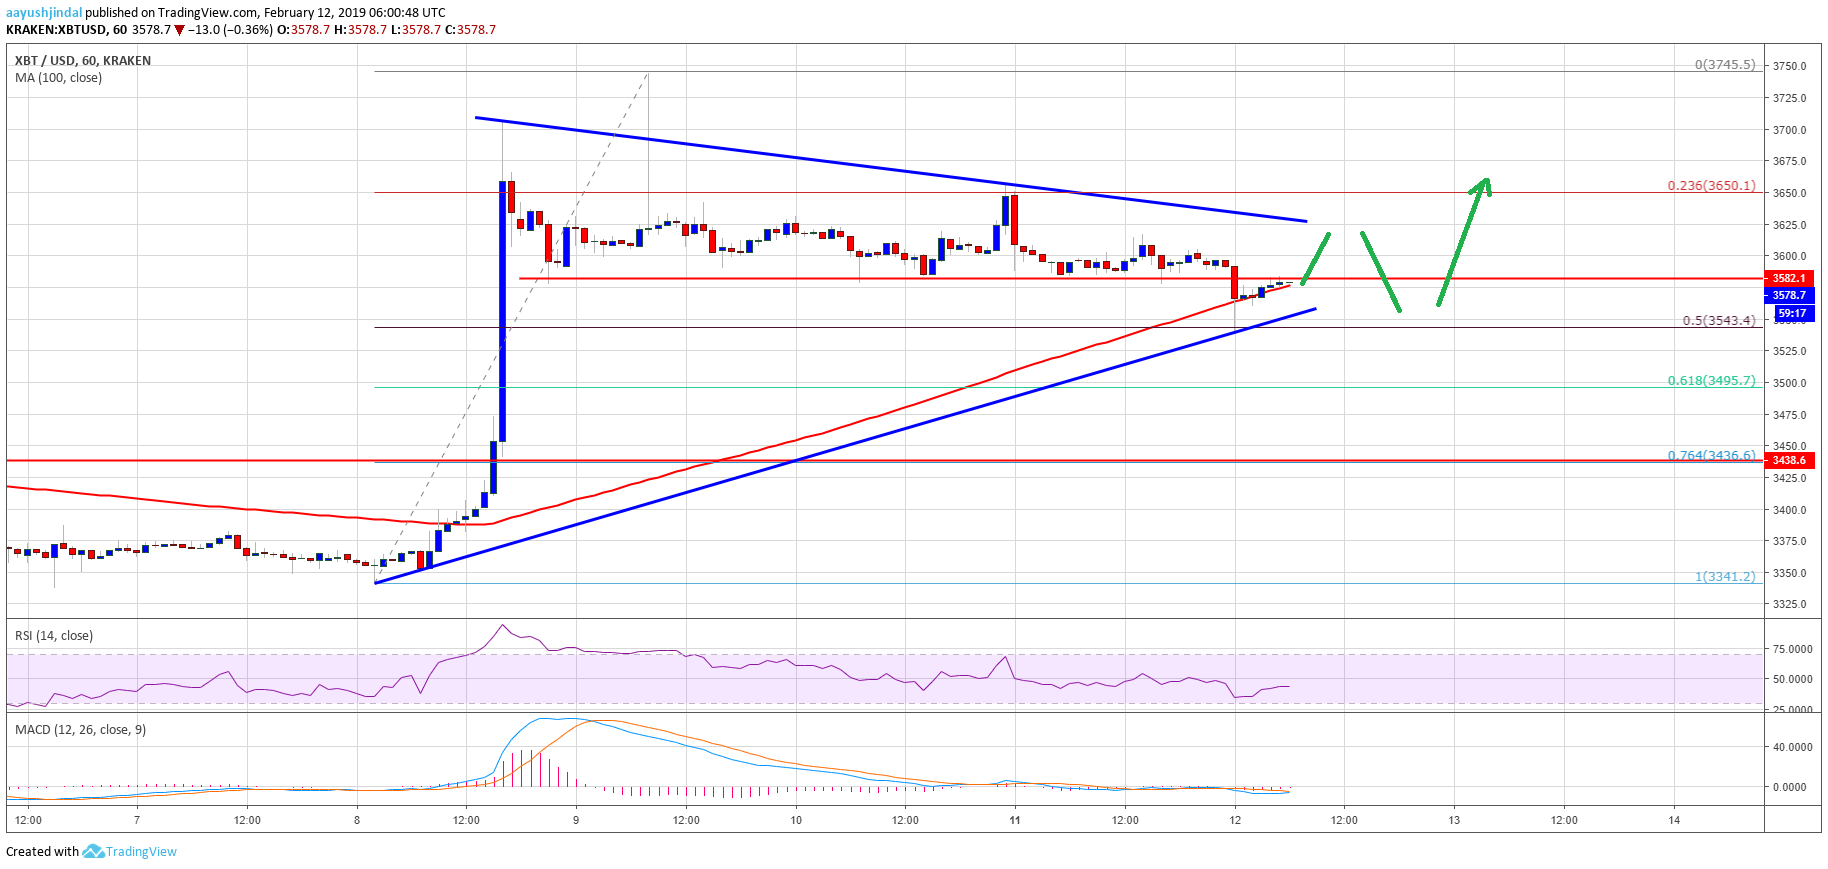
- Bitcoin price corrected lower recently below the $3,640 and $3,580 supports against the US Dollar.
- There is a contracting triangle forming with resistance near $3,625 on the hourly chart of the BTC/USD pair (data feed from Kraken).
- The price could either climb above the $3,625 resistance or extend the correction below $3,560.
Bitcoin price declined recently below the $3,580 support against the US Dollar. BTC found support near $3,550 and it seems like the market is preparing for the next move in the near term.
Bitcoin Price Analysis
After trading above the $3,700 resistance, bitcoin price started a downside correction against the US Dollar. The BTC/USD pair topped at $3,745 and later corrected below $3,700 and $3,640. There was a break below the 23.6% Fib retracement level of the last leg from the $3,340 swing low to $3,745 high. More importantly, there was a break below the $3,600 and $3,580 support levels. The price traded close to the $3,550 support area, where buyers emerged.
There was a complete test of the 50% Fib retracement level of the last leg from the $3,340 swing low to $3,745 high. Besides, the 100 hourly simple moving average acted as a strong support and prevented additional losses below $3,540. The price bounced back, but the previous supports at $3,580 and $3,600 are acting as resistances. More importantly, there is a contracting triangle forming with resistance near $3,625 on the hourly chart of the BTC/USD pair. A successful break above the $3,600 and $3,620 resistances could set the pace for more gains in the near term. The next key resistances are $3,700 and $3,750. On the other hand, a close below $3,550 might open the doors for a drop to $3,500 or $3,440.

Looking at the chart, bitcoin price is likely preparing for the next break either above $3,625 or below $3,550. It seems like buyers could gain control as long as the price is above $3,550 and the 100 hourly SMA.
Technical indicators
Hourly MACD – The MACD is about to move back in the bullish zone.
Hourly RSI (Relative Strength Index) – The RSI for BTC/USD is still below the 50 level, which is a negative sign.
Major Support Level – $3,550
Major Resistance Level – $3,625


