
Reason to trust
How Our News is Made
Strict editorial policy that focuses on accuracy, relevance, and impartiality
Ad discliamer
Morbi pretium leo et nisl aliquam mollis. Quisque arcu lorem, ultricies quis pellentesque nec, ullamcorper eu odio.
- Bitcoin price started a downside correction after trading above $4,080 against the US Dollar.
- There is a major bullish trend line formed with support at $3,940 on the hourly chart of the BTC/USD pair (data feed from Kraken).
- The price is likely to find bids near $3,940 and $3,900 for a fresh upward move in the near term.
Bitcoin price corrected lower below $4,000 against the US Dollar. BTC is now trading above the $3,940 and $3,900 support levels and it could bounce back.
Bitcoin Price Analysis
Yesterday, we saw a nice upward move above $4,000 in bitcoin price against the US Dollar. The BTC/USD pair gained bullish momentum and traded towards the $4,100 level. A new weekly high was formed at $4,084 and later the price started a downside correction. It moved below the $4,000 and $3,980 support levels. Moreover, there was a break below the 23.6% Fib retracement level of the recent upside from the $3,759 low to $4,084 high.
The price traded close to the $3,900 level and tested the $3,920 support. There was no complete test of the 50% Fib retracement level of the recent upside from the $3,759 low to $4,084 high. At the outset, the price is consolidating above the $3,950 level. On the downside, the main support is near $3,950. There is also a major bullish trend line formed with support at $3,940 on the hourly chart of the BTC/USD pair. Below the trend line, the next key support is near the $3,920 level. On the upside, there is a connecting bearish trend line with resistance at $4,000 on the same chart. Therefore, the price could make the next move either above $4,000 or below $3,920 in the near term.
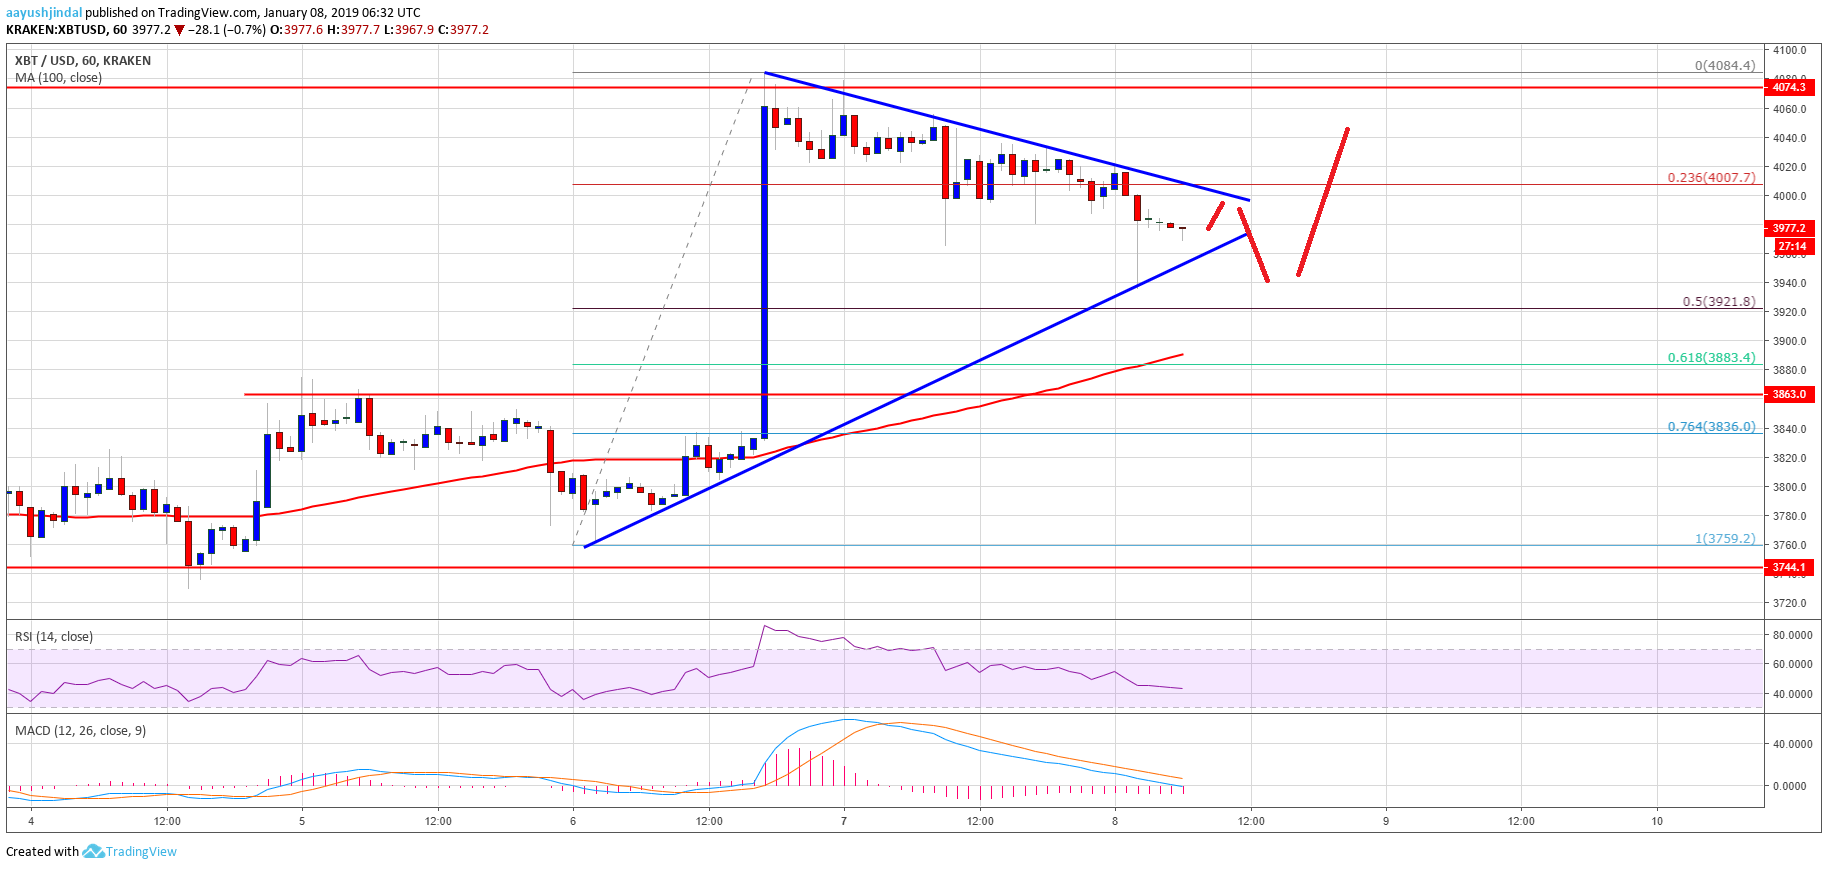
Looking at the chart, bitcoin price seems to be preparing for the next move either above $4,000 or below $3,920. Above $4,000, BTC could test the $4,080 and $4,100 resistance levels.
Technical indicators
Hourly MACD – The MACD for BTC/USD is now placed in the bearish zone, indicating a negative bias.
Hourly RSI (Relative Strength Index) – The RSI for BTC/USD is well below the 50 level, with a bearish angle.
Major Support Level – $3,940
Major Resistance Level – $4,000