Reason to trust

How Our News is Made
Strict editorial policy that focuses on accuracy, relevance, and impartiality
Ad discliamer
Morbi pretium leo et nisl aliquam mollis. Quisque arcu lorem, ultricies quis pellentesque nec, ullamcorper eu odio.
Bitcoin price peeped above the $24,000 price level after falling from the $25,000 mark few trading sessions ago.
Over the past week Bitcoin secured a 6% gain and on the daily chart the coin fell by 1%. This had pointed towards a sign of consolidation.
Bitcoin price had formed higher highs and high lows which are an indication of bullishness on the chart.
Incase the king coin manages to remain above the $24,000 mark for a substantial period of time, it can aim at $27,000 over the upcoming trading sessions.
In case the coin loses momentum, it can fall to $23,000 level. Technical outlook for the king coin pointed towards the continued bullishness which meant that buying strength hadn’t faded away from the market.
For Bitcoin price to hold onto present price momentum, a continued buying strength will prove necessary.
The global cryptocurrency market cap today was at $1.2 Trillion, with a 1.6% fall in last 24 hours. With consistent buying strength, Bitcoin will experience a tough resistance at the $27,000 level.
Bitcoin Price Analysis: One Day Chart

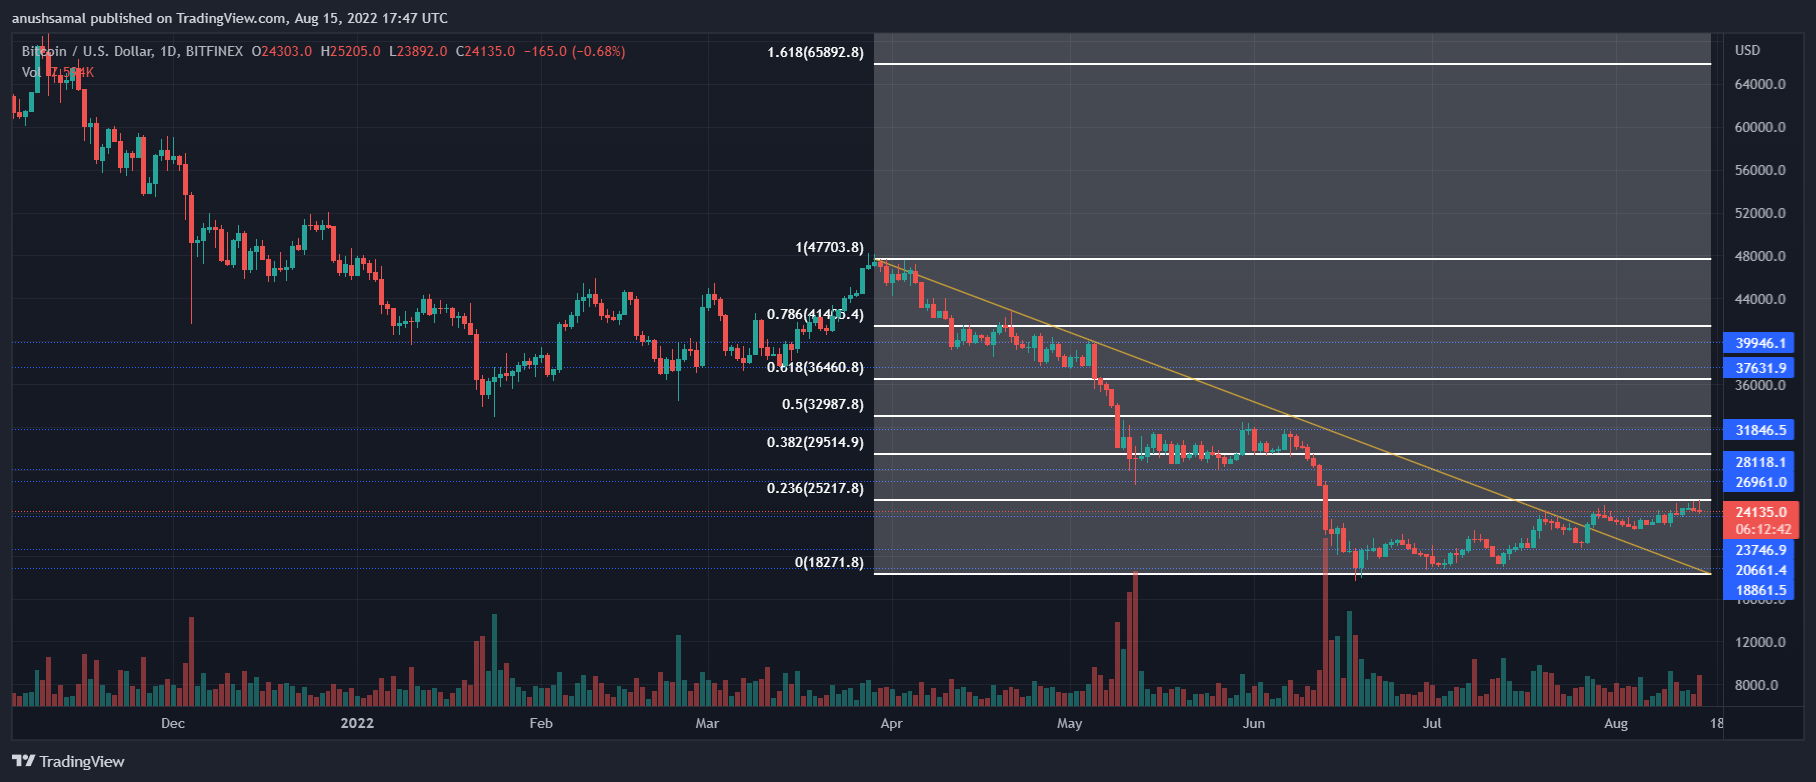
BTC was trading at $24,100 at the time of writing. Over the past week, the coin had witnessed price appreciation. In the past 24 hours, Bitcoin price moved laterally. According to the Fibonacci levels, if the coin manages to trade above the 23.6% level, a move to 38.2% could be possible.
This meant that overhead resistance level stood at $27,000. A retracement could cause Bitcoin to fall to $23,000 and then to $20,000 respectively. Over the last trading session, the amount of BTC traded was in red which meant that buying strength noted a downtick.
Technical Analysis

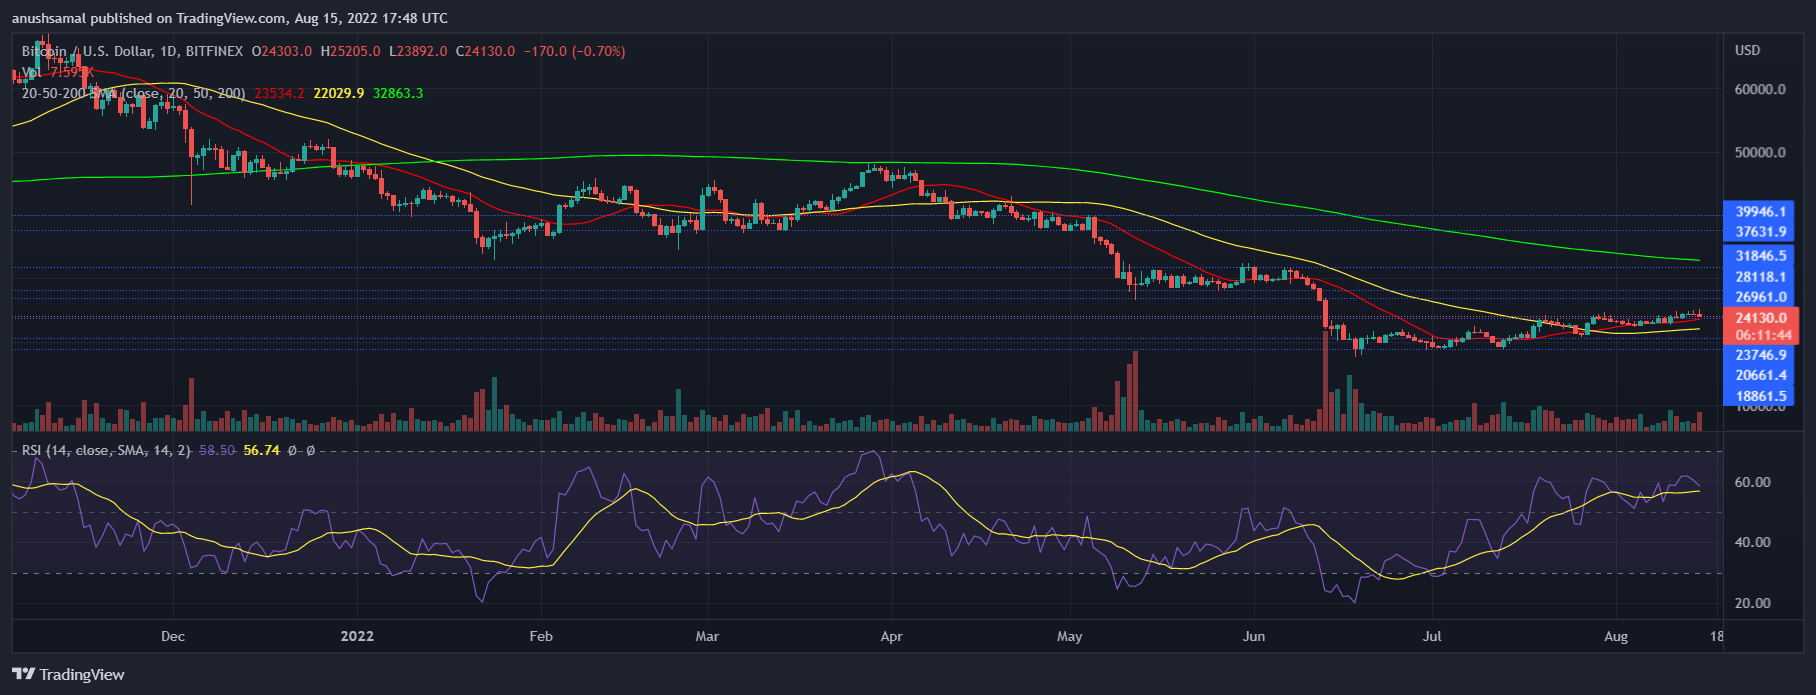
The lateral movement in Bitcoin’s chart had indicated fall in buying strength on the king coin’s chart. The consolidation did not have significant effect on the technical outlook. The Relative Strength Index captured a small depreciation in buying strength, despite this, RSI was well above the half-line.
A reading above the half-line is an indication of more buyers compared to the sellers of the coin. Bitcoin price was trading above the 20-SMA line. Trading above that was an indication that BTC’s buyers were driving the price momentum in the market. This also meant that at lower levels too, BTC had demand on its chart.

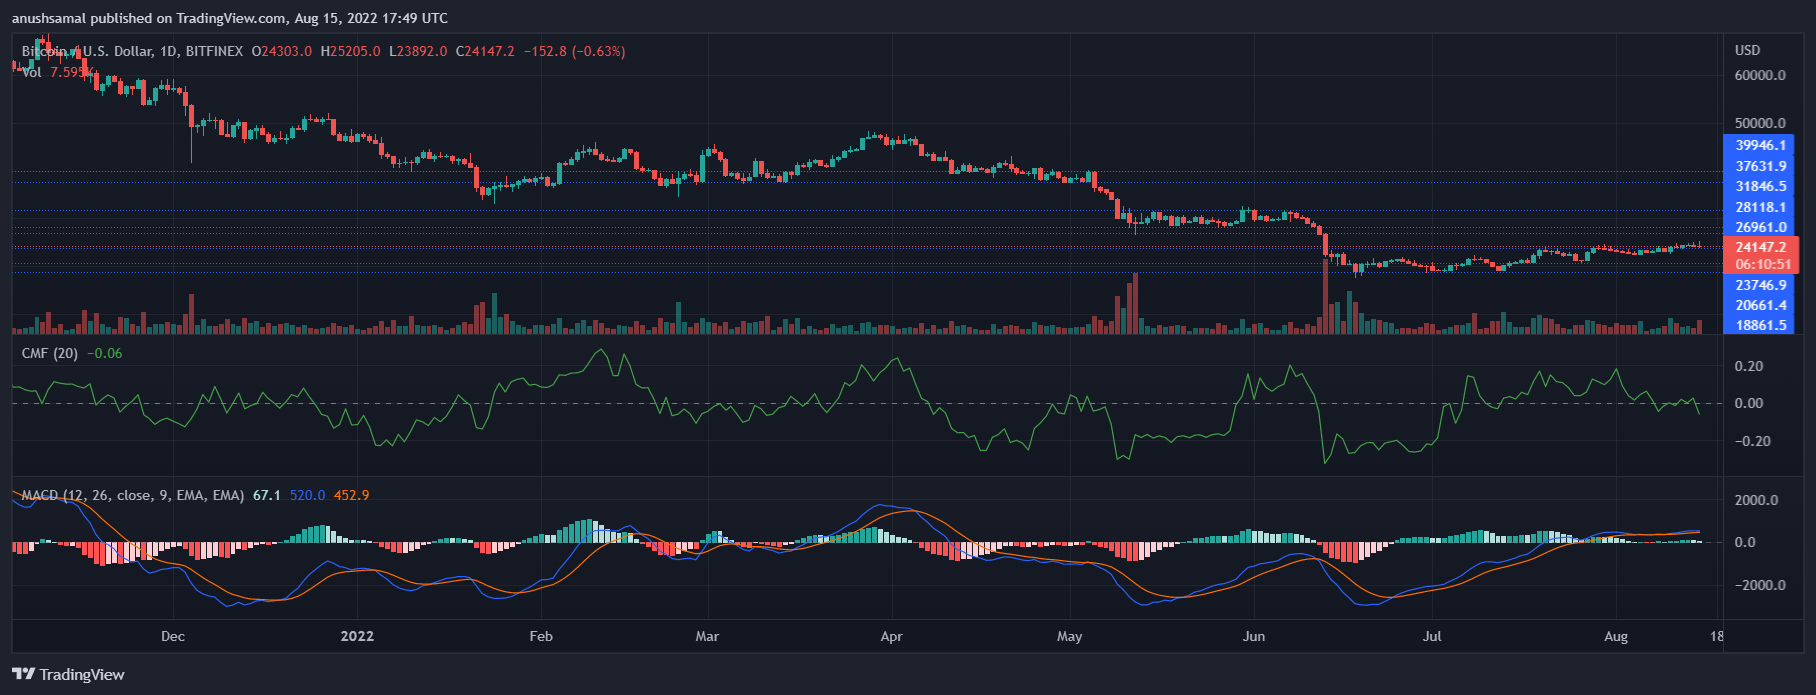
The rise in price was depicted on other technical indicator. The Moving Average Convergence Divergence points towards the current price momentum and reversals in the same. MACD after a bullish crossover gave rise to green histograms above the half-line which were buy signal for the coin.
Chaikin Money Flow reads the capital inflows and outflows on the chart. Even with other bullish indicators, CMF was below the half-line indicating that capital inflows were lesser than outflows at press time.
Featured image from UnSplash, Chart from TradingView.com


