
Reason to trust
How Our News is Made
Strict editorial policy that focuses on accuracy, relevance, and impartiality
Ad discliamer
Morbi pretium leo et nisl aliquam mollis. Quisque arcu lorem, ultricies quis pellentesque nec, ullamcorper eu odio.
Bitcoin price declined over $5,000 and tested the $45,000 support against the US Dollar. BTC is now correcting losses, but it is facing a strong resistance near $54,000 and $55,000.
- Bitcoin is struggling to climb back above the $54,000 and $55,000 resistance levels.
- The price is now well below $55,000 and the 100 hourly simple moving average.
- There was a break below a major bullish trend line with support near $54,500 on the hourly chart of the BTC/USD pair (data feed from Kraken).
- The same trend line support and $55,000 are now acting as a strong resistance.
Bitcoin Price is Showing Signs of More Losses
After forming a short-term top, bitcoin price started a sharp decline below the $56,000 level. BTC broke the key $55,000 support level and the 100 hourly simple moving average to move into a bearish zone.
There was also a break below a major bullish trend line with support near $54,500 on the hourly chart of the BTC/USD pair. The pair crashed over $5,000 and it even spiked below the $50,000 support. It tested the $45,000 support before correcting higher.
There was a break above the $50,000 and $52,000 levels. The price even climbed above the 50% Fib retracement level of the downward move from the $58,350 swing high to $45,000 swing low.
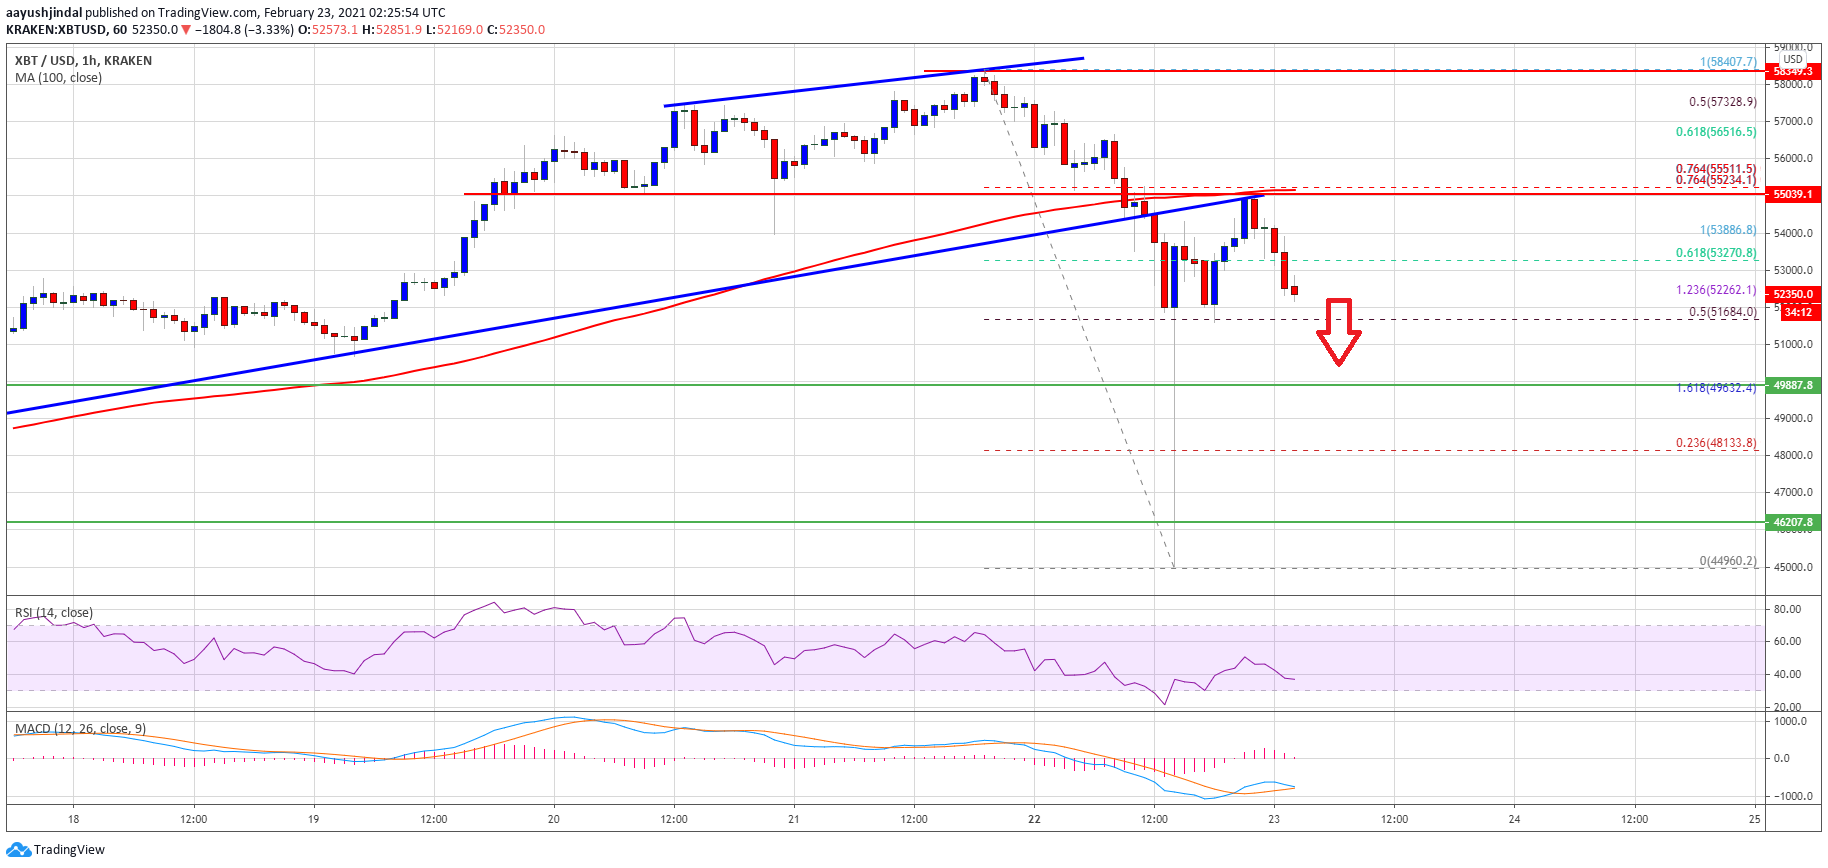
Source: BTCUSD on TradingView.com
However, the same trend line support and $55,000 are now acting as a strong resistance. The 100 hourly simple moving average is also near the $55,000 level along with the 76.4% Fib retracement level of the downward move from the $58,350 swing high to $45,000 swing low.
Bitcoin is now moving lower and it seems like it could revisit the $50,000 support level. If the price fails to stay above $50,000, it could decline towards the $46,200 support.
Upsides Capped in BTC?
If bitcoin remains stable above the $50,000 level, it could make another attempt to settle above $54,000. The first major resistance is near the $55,000 level and the 100 hourly SMA.
To start a fresh increase and move into a positive zone, the price must clear $55,000. The next major resistance sits near the $57,000 level.
Technical indicators:
Hourly MACD – The MACD is gaining momentum in the bearish zone.
Hourly RSI (Relative Strength Index) – The RSI for BTC/USD is well below the 50 level.
Major Support Levels – $52,000, followed by $50,000.
Major Resistance Levels – $54,000, $55,000 and $57,000.