
Reason to trust
How Our News is Made
Strict editorial policy that focuses on accuracy, relevance, and impartiality
Ad discliamer
Morbi pretium leo et nisl aliquam mollis. Quisque arcu lorem, ultricies quis pellentesque nec, ullamcorper eu odio.
Bitcoin price plummeted consistently after it breached the $20,000 mark. Over the last 24 hours, the Bitcoin has registered very little movement.
In the past week, BTC lost close to 16% of its value. BTC quickly attempted to recover from the $19,000 price mark on its chart.
However, the bulls couldn’t defend that price mark. The closest support line for the Bitcoin price was $18,000. Bitcoin has been on a consistent downtrend over the past few months.
The technical outlook of the coin pointed towards increased bearish strength.
Selling pressure continued to exceed buying strength on the one-day chart. The $20,000 price mark will prove to be a strong resistance mark.
$20,000 is the key resistance mark for the Bitcoin price. Increased buying power may provide the coin with some temporary relief.
The global cryptocurrency market cap today is at $962 billion, with a 0.6% positive change in the last 24 hours.
Bitcoin Price Analysis: One Day Chart
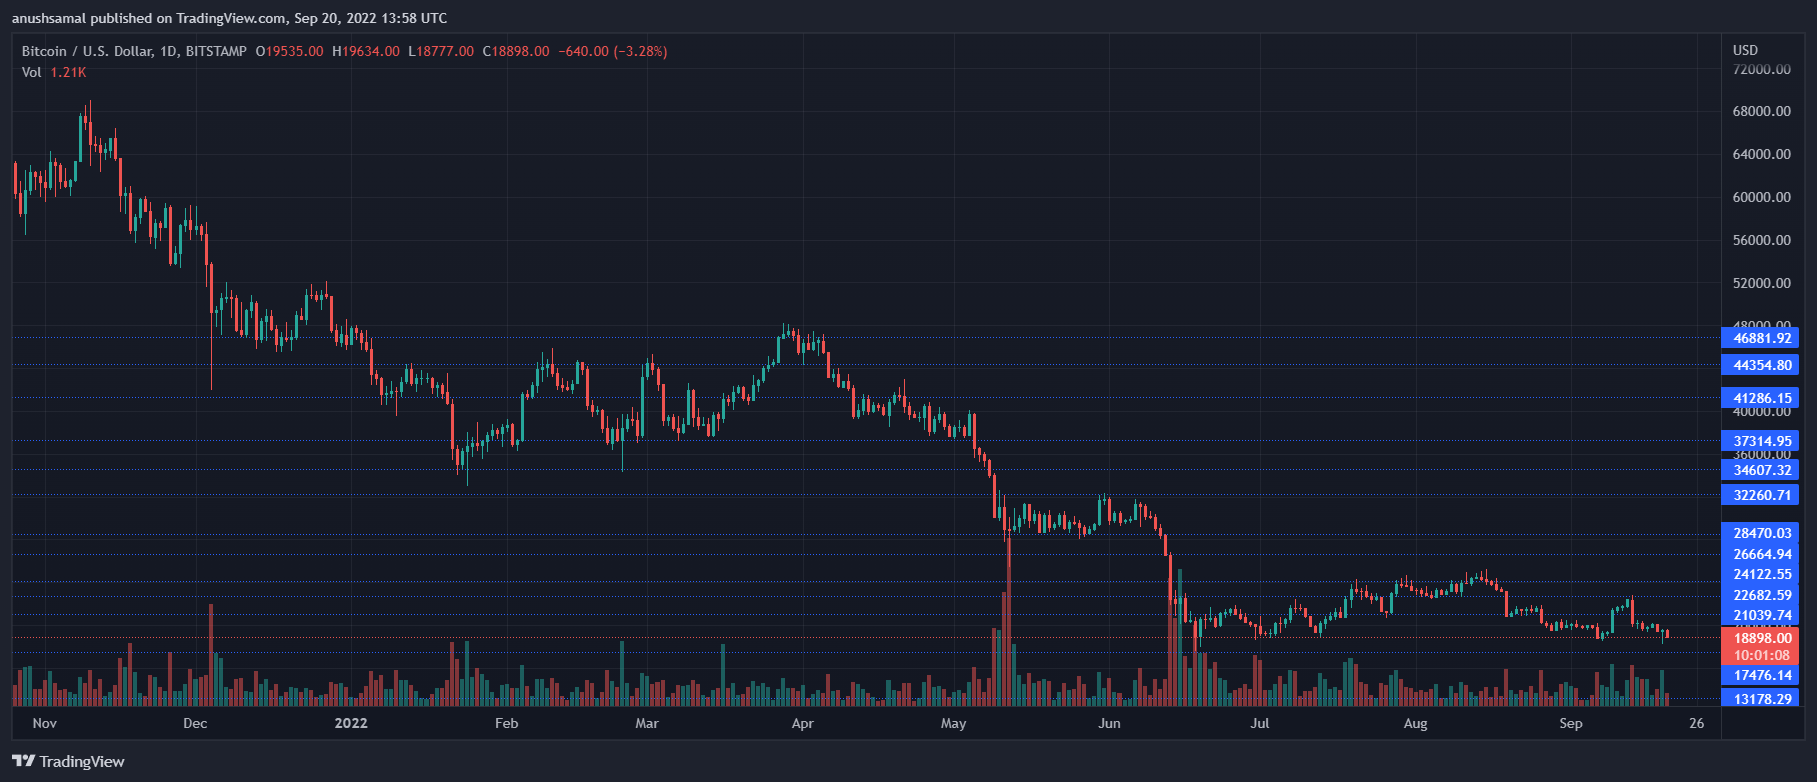
BTC was trading at $18,800 at the time of writing. A few sessions before this, Bitcoin was trading above the $19,000 price mark. The overhead resistance for the coin was at $20,000, which BTC struggled to move past over the past few days.
A sharp decline in buying strength has caused BTC to plunge further and quickly. If BTC moves above the $20,000 price level, the bearish thesis could be invalidated.
On the other hand, lower demand for the asset can even drag Bitcoin price to $17,400. A fall below that price mark could attempt to bring the price of the asset to $14,000.
The amount of Bitcoin traded in the last trading session declined, signalling that sellers took over at the time of writing.
Technical Analysis
The fall in buyers caused the Bitcoin price to tumble further. There was a sharp fall in buying strength just a week ago, and ever since, BTC has continued to depreciate on its chart.
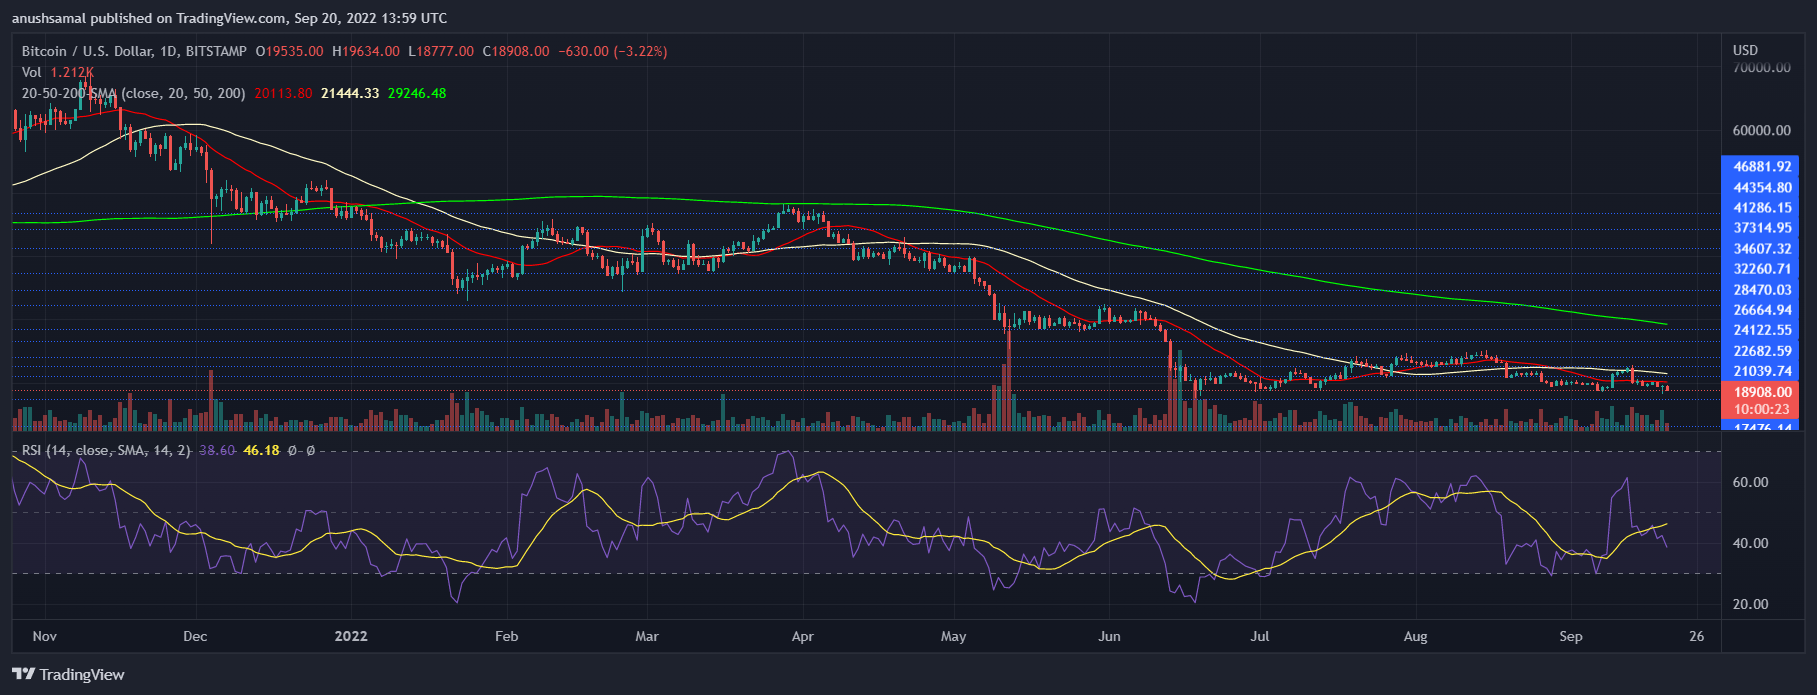
The Relative Strength Index was below the half-line, which meant that sellers were numerous as compared to buyers.
The Bitcoin price travelled below the 20-SMA line, displaying a fall in demand. It also meant that sellers were driving the price momentum in the market at the time of writing.
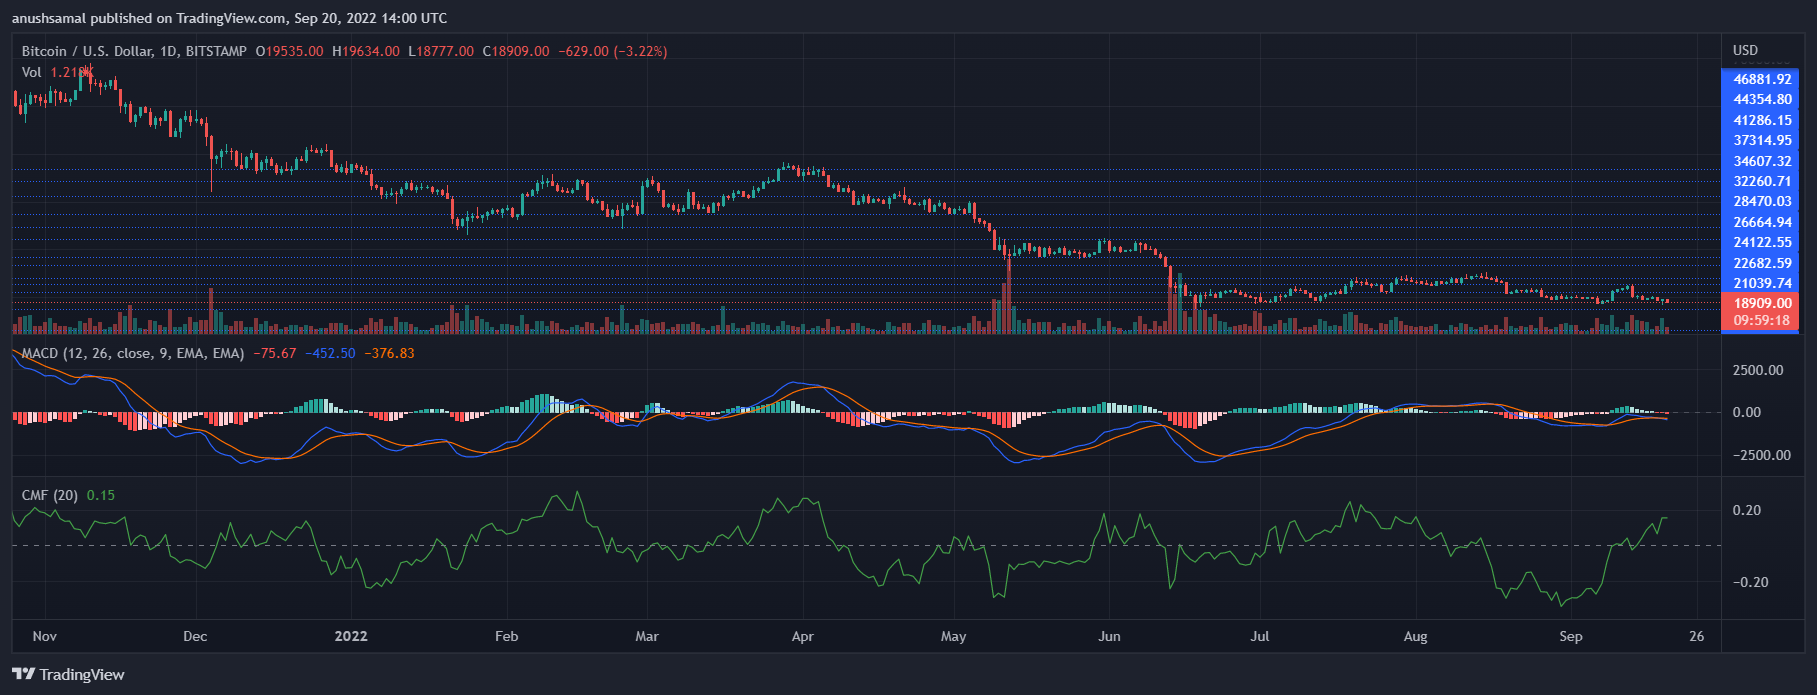
Other technical indicators pointed towards a bearish price signal. The Moving Average Convergence Divergence measures the market momentum and overall price direction in the market.
The MACD underwent a bearish crossover and then displayed red histograms, which were sell signal for the coin.
On the other hand, Chaikin Money Flow remained positive with an uptick above the half-line. The indicator determines the amount of capital inflows and outflows.
At the time of writing, CMF displayed increased capital inflows.
Featured image from UnSplash, Chart: TradingView.com


