
Reason to trust
How Our News is Made
Strict editorial policy that focuses on accuracy, relevance, and impartiality
Ad discliamer
Morbi pretium leo et nisl aliquam mollis. Quisque arcu lorem, ultricies quis pellentesque nec, ullamcorper eu odio.
Bitcoin price cleared the key $35,000 resistance. BTC is showing positive signs and might rally toward the $36,200 and $37,000 levels in the near term.
- Bitcoin is gaining pace above the $35,000 resistance.
- The price is trading above $35,000 and the 100 hourly Simple moving average.
- There was a break above a rising channel with resistance at $34,850 on the hourly chart of the BTC/USD pair (data feed from Kraken).
- The pair is showing positive signs and might rise toward the $37,000 resistance in the near term.
Bitcoin Price Breaks Hurdle
Bitcoin price remained well-bid above the $34,000 support zone. BTC formed a base, completed a consolidation phase, and recently started a decent increase above the $34,750 resistance.
There was a break above a rising channel with resistance at $34,850 on the hourly chart. The bulls were able to pump the price above the last swing high and $35,500. It traded to a new multi-week high at $35,945 and is still showing positive signs.
Bitcoin is now trading above $34,260 and the 100 hourly Simple moving average. It is also well above the 23.6% Fib retracement level of the recent increase from the $34,120 swing low to the $35,945 high.
On the upside, immediate resistance is near the $35,950 level. The next key resistance could be near $36,200. A clear move above the $36,200 resistance might open the doors for a decent 5% increase toward the $37,000 resistance.
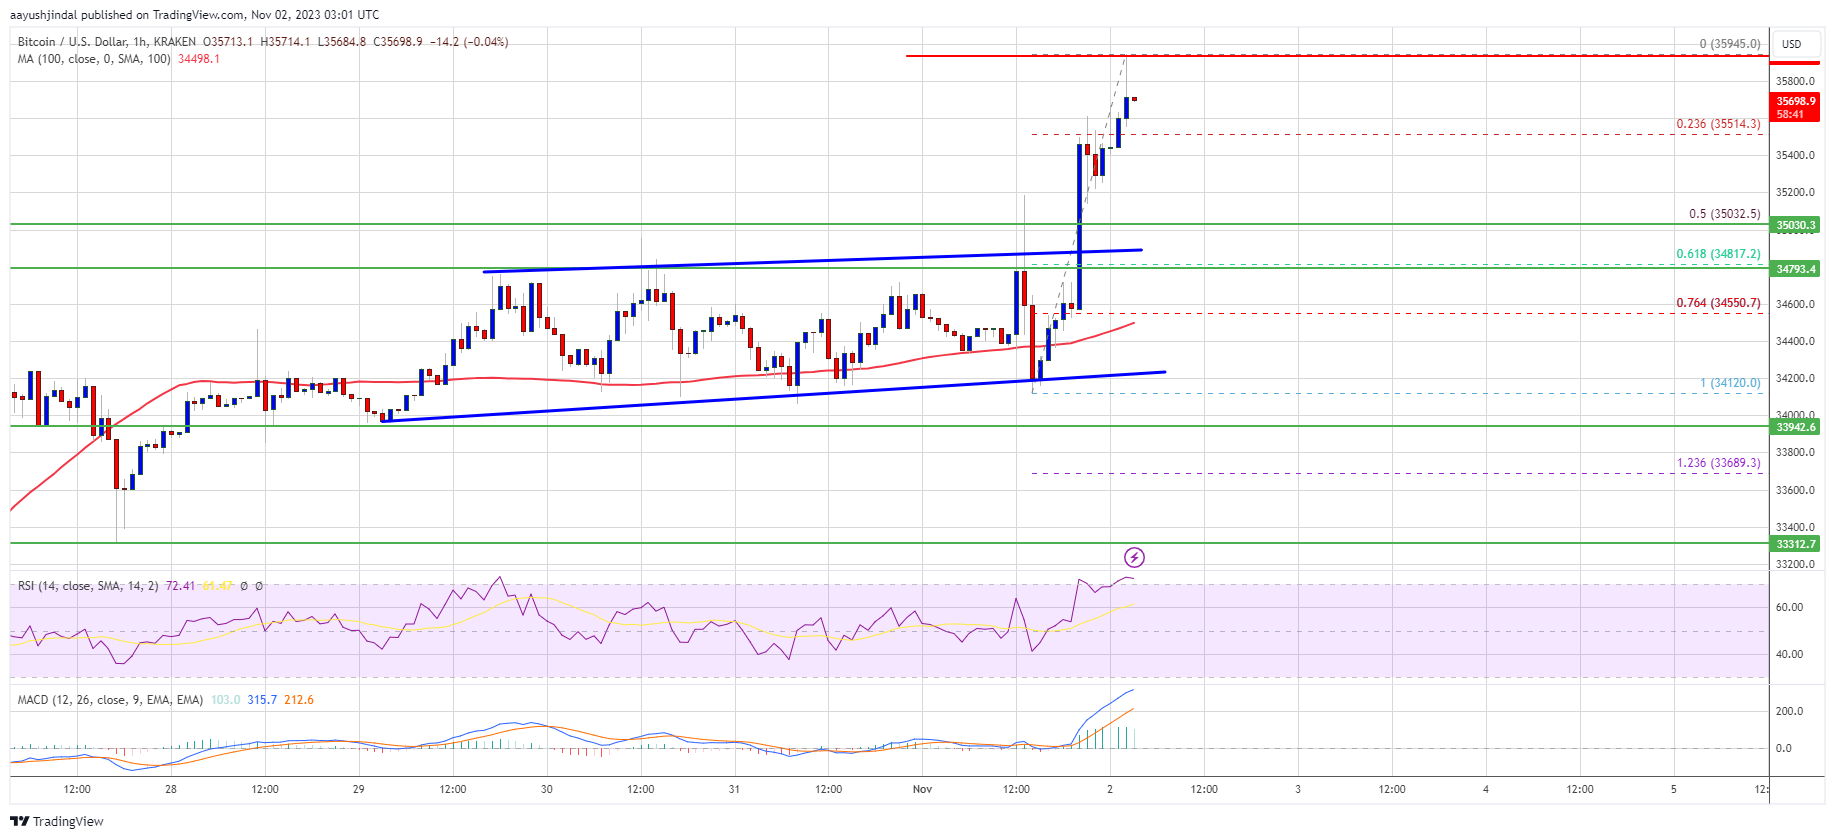
Source: BTCUSD on TradingView.com
The next key resistance could be $37,500, above which the price could rise toward $38,000. Any more gains might send BTC toward the $38,800 level.
Are Dips Limited In BTC?
If Bitcoin fails to rise above the $35,950 resistance zone, it could start a downside correction. Immediate support on the downside is near the $35,500 level.
The next major support is near the $35,000 level or the 50% Fib retracement level of the recent increase from the $34,120 swing low to the $35,945 high. If there is a move below $35,000, there is a risk of more downsides. In the stated case, the price could drop toward the $34,500 level or the 100 hourly Simple moving average.
Technical indicators:
Hourly MACD – The MACD is now gaining pace in the bullish zone.
Hourly RSI (Relative Strength Index) – The RSI for BTC/USD is now in the overbought zone.
Major Support Levels – $35,500, followed by $35,000.
Major Resistance Levels – $35,950, $36,200, and $37,000.


