
Reason to trust
How Our News is Made
Strict editorial policy that focuses on accuracy, relevance, and impartiality
Ad discliamer
Morbi pretium leo et nisl aliquam mollis. Quisque arcu lorem, ultricies quis pellentesque nec, ullamcorper eu odio.
Bitcoin started an upside correction from the $18,150 zone against the US Dollar. BTC is back above $19,200 and a break above $19,500 could spark a fresh rally.
- Bitcoin is showing a few positive signs above the $19,000 level.
- The price is trading above $19,000 and the 100 hourly simple moving average.
- There is a key contracting triangle forming with support near $19,200 on the hourly chart of the BTC/USD pair (data feed from Kraken).
- The pair could stage a fresh rally if there is a clear move above the $19,500 resistance zone.
Bitcoin Price Recovers
Bitcoin price remained well bid above the $18,150 level. BTC traded as low as $18,138 and started a decent recovery wave. The price was able to recover above the $18,800 and $19,000 resistance levels.
There was a move above the 50% Fib retracement level of the downward move from the $19,888 swing high to $18,138 low. The bulls even pushed the price above the $19,200 resistance zone. It is now trading above $19,000 and the 100 hourly simple moving average.
There is also a key contracting triangle forming with support near $19,200 on the hourly chart of the BTC/USD pair. Bitcoin price is showing a few positive signs above the $19,000 level.
On the upside, an immediate resistance is near the $19,475 level. It is near the 76.4% Fib retracement level of the downward move from the $19,888 swing high to $18,138 low. The next major resistance sits near the $19,680 level.
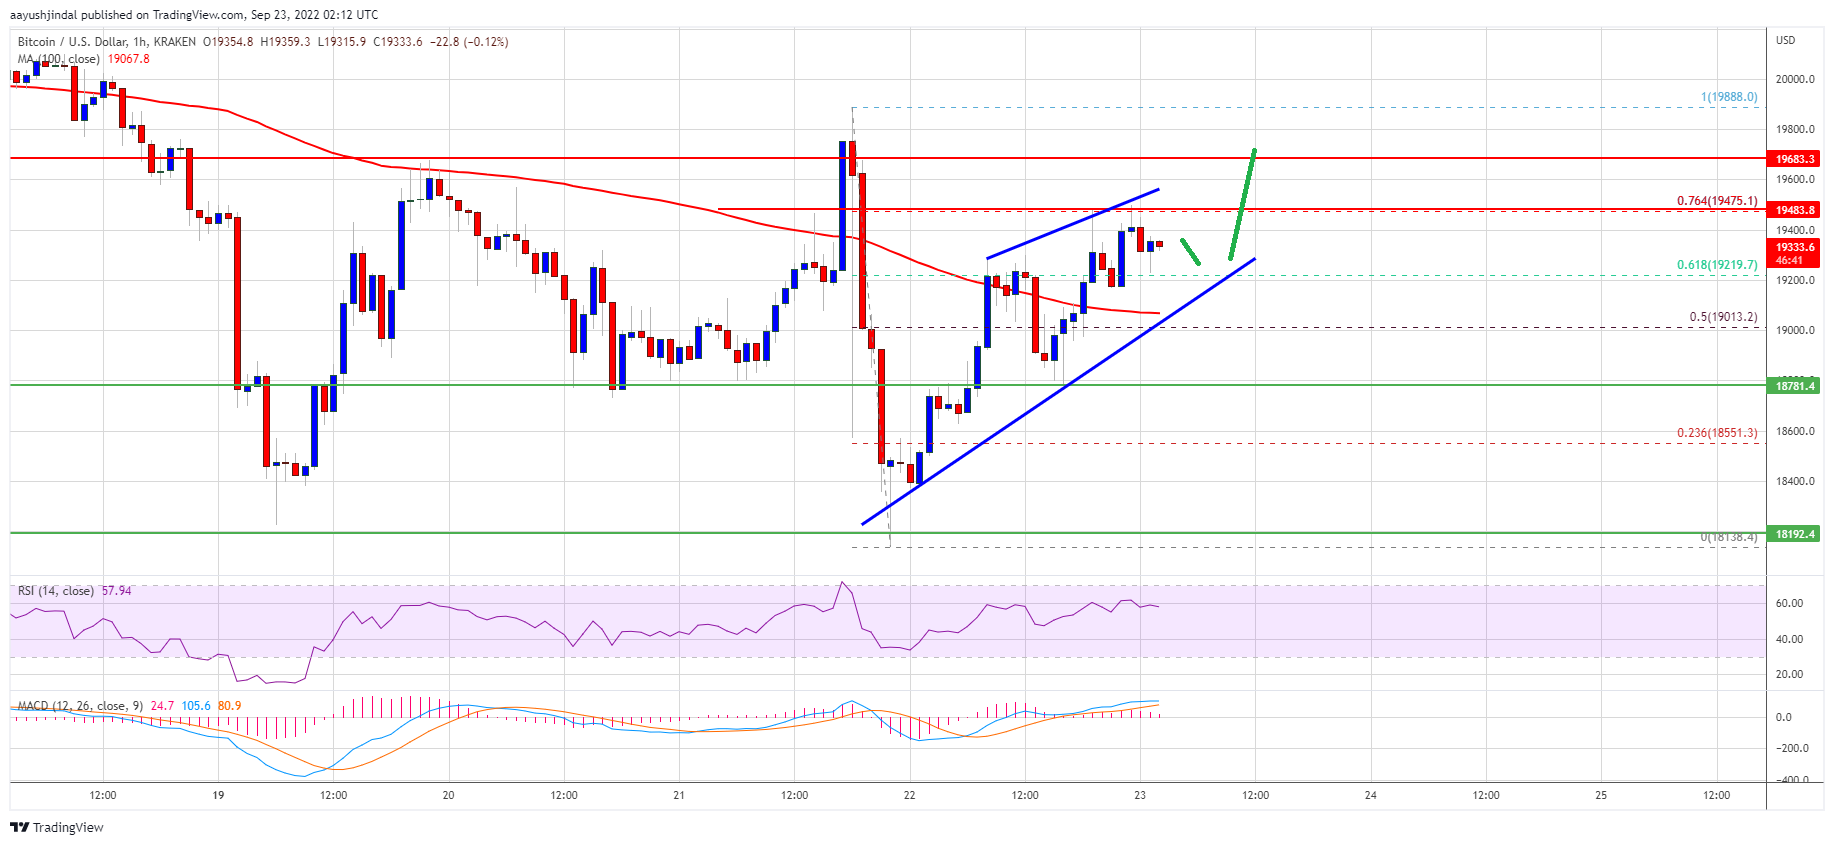
Source: BTCUSD on TradingView.com
A close above the $19,680 level might start a fresh surge to $20,000. Any more gains might send the price towards the $20,500 resistance zone.
Fresh Decline in BTC?
If bitcoin fails to recover above the $19,680 zone, it could start a fresh decline. An immediate support on the downside is near the $19,200 zone and the triangle lower trend line.
The next major support is near the $19,000 level and the 100 hourly SMA. A clear move below the $19,000 zone could set the pace for a fresh decline. In the stated case, the price may even test the $18,500 level.
Technical indicators:
Hourly MACD – The MACD is now losing pace in the bullish zone.
Hourly RSI (Relative Strength Index) – The RSI for BTC/USD is now above the 50 level.
Major Support Levels – $19,200, followed by $19,000.
Major Resistance Levels – $19,500, $19,680 and $20,000.


